Price Up, Open Interest Down: Short Covering or Profit Taking?
Most traders learn one rule about open interest: when price goes up and OI drops, longs are taking profit. The smart money is selling into strength. Time to be cautious.
On STO-USDT perpetuals on April 1, 2026, that rule gave the wrong answer at the worst moment. Price ran +125% from the session open. Twice, OI dropped sharply while price spiked. Both times, the standard interpretation would have sent you to the sidelines. Both times, the broader signal pointed to a different mechanism than standard long profit-taking.
Key takeaways:
- “Price up + OI down” on a perpetual means positions are closing, but without knowing which side closed, the interpretation is incomplete. Context from Net Taker Imbalance, Total Volume Z-Score, and Relative Price Impact narrows the interpretation.
- In a thin book, a short-covering or liquidation cascade can produce a near-zero Buy Volume Z-Score even as price spikes 10–23%, because the forced buy flow may still be small in notional terms relative to the book’s lack of depth.
- The setup for the second +23% spike was fully readable eight minutes before it fired: OI at a new session high, 60m Open Interest Z-Score positive, 60m Net Taker Imbalance sustained above +3.5, 5m Net Taker Imbalance turning positive, Relative Price Impact elevated.
- When both Buy Volume Z-Score and Sell Volume Z-Score are simultaneously negative before a spike, participation is weak relative to baseline and the move is more likely liquidity-driven than broadly demand-driven. Magnitude is often larger. Mean-reversion is often faster.
- The same scanner framework that detected the squeeze on Day 1 correctly held through the Day 2 rearm, and correctly classified the afternoon vacuum as a different regime.
A quick primer on the indicators
The metrics used throughout are defined below. Skip this section if you already know them.
Open Interest (OI) is the total number of unsettled contracts on the exchange. When OI rises, new contracts are being created: a new long and a new short are matched into the market. When OI falls, existing contracts are being closed: an old long and an old short leave the market.
Net Taker Imbalance measures the directional bias of aggressive order flow, calculated as (buy notional − sell notional) / total notional × 100. The scale runs from −100 (all selling) to +100 (all buying). At zero, flow is balanced. At +20, buyers took 60% of notional and sellers 40%, because the buy share is always (100 + Net Taker Imbalance) / 2. Net Taker Imbalance runs on three timeframes: 5m, 15m, and 60m. The 60m reading is the regime signal: the directional character of the last hour, not just the last few minutes.
Volume Z-Score (Buy Volume Z-Score, Sell Volume Z-Score) measures how many standard deviations the current window’s buy or sell volume is above or below its historical mean. A z-score of +3 means buy volume is running three standard deviations above what is normal for this instrument. A negative z-score means volume is below average. The z-score is computed on a rolling window, not a fixed daily reset, so it adapts to the current regime.
For the full scanner workflow behind that calculation, seeZ-Score Volume Anomaly Detection in Trading.
Relative Price Impact measures how much price moved per dollar of volume transacted. A high Relative Price Impact means price moves a lot on small notional, the order book is thin. A low Relative Price Impact means large volume barely moves price: the book is deep and absorbing flow.
Open Interest Z-Score normalises the rate of change in OI, not the absolute level. A positive value means OI is growing faster than its historical average pace: positions are accumulating above normal. A negative value means OI is contracting faster than normal: positions are closing at above-average pace. On the 5m timeframe it is fast-moving; on the 60m it smooths out to show whether the accumulation or depletion rate is anomalous.
Buy Volume Concentration is derived as Buy Volume Z-Score minus Buy Trade Count Z-Score. When positive, dollar volume grows faster than trade count: average trade size is increasing. Fewer, larger trades relative to count. That points to concentrated execution rather than broad retail-style fragmentation. When negative, many small trades are fragmented across the window: retail or algorithmic.
April 1: STO-USDT Binance Perpetuals
The session opened at $0.2175. By the end of the day, the high was $0.4905, a +125% move from the open. Two distinct spikes. Two OI collapses. One setup that was visible two hours before the second spike.
The structural cause was on-chain. A single wallet withdrew 25.5 million STO tokens (11.32% of circulating supply, ~$4.85M) from Binance before the session, stripping exchange-side sell liquidity (CoinJournal). That withdrawal likely reduced available exchange-side liquidity and provides a plausible backdrop for the thin-book conditions reflected in the scanner readings.
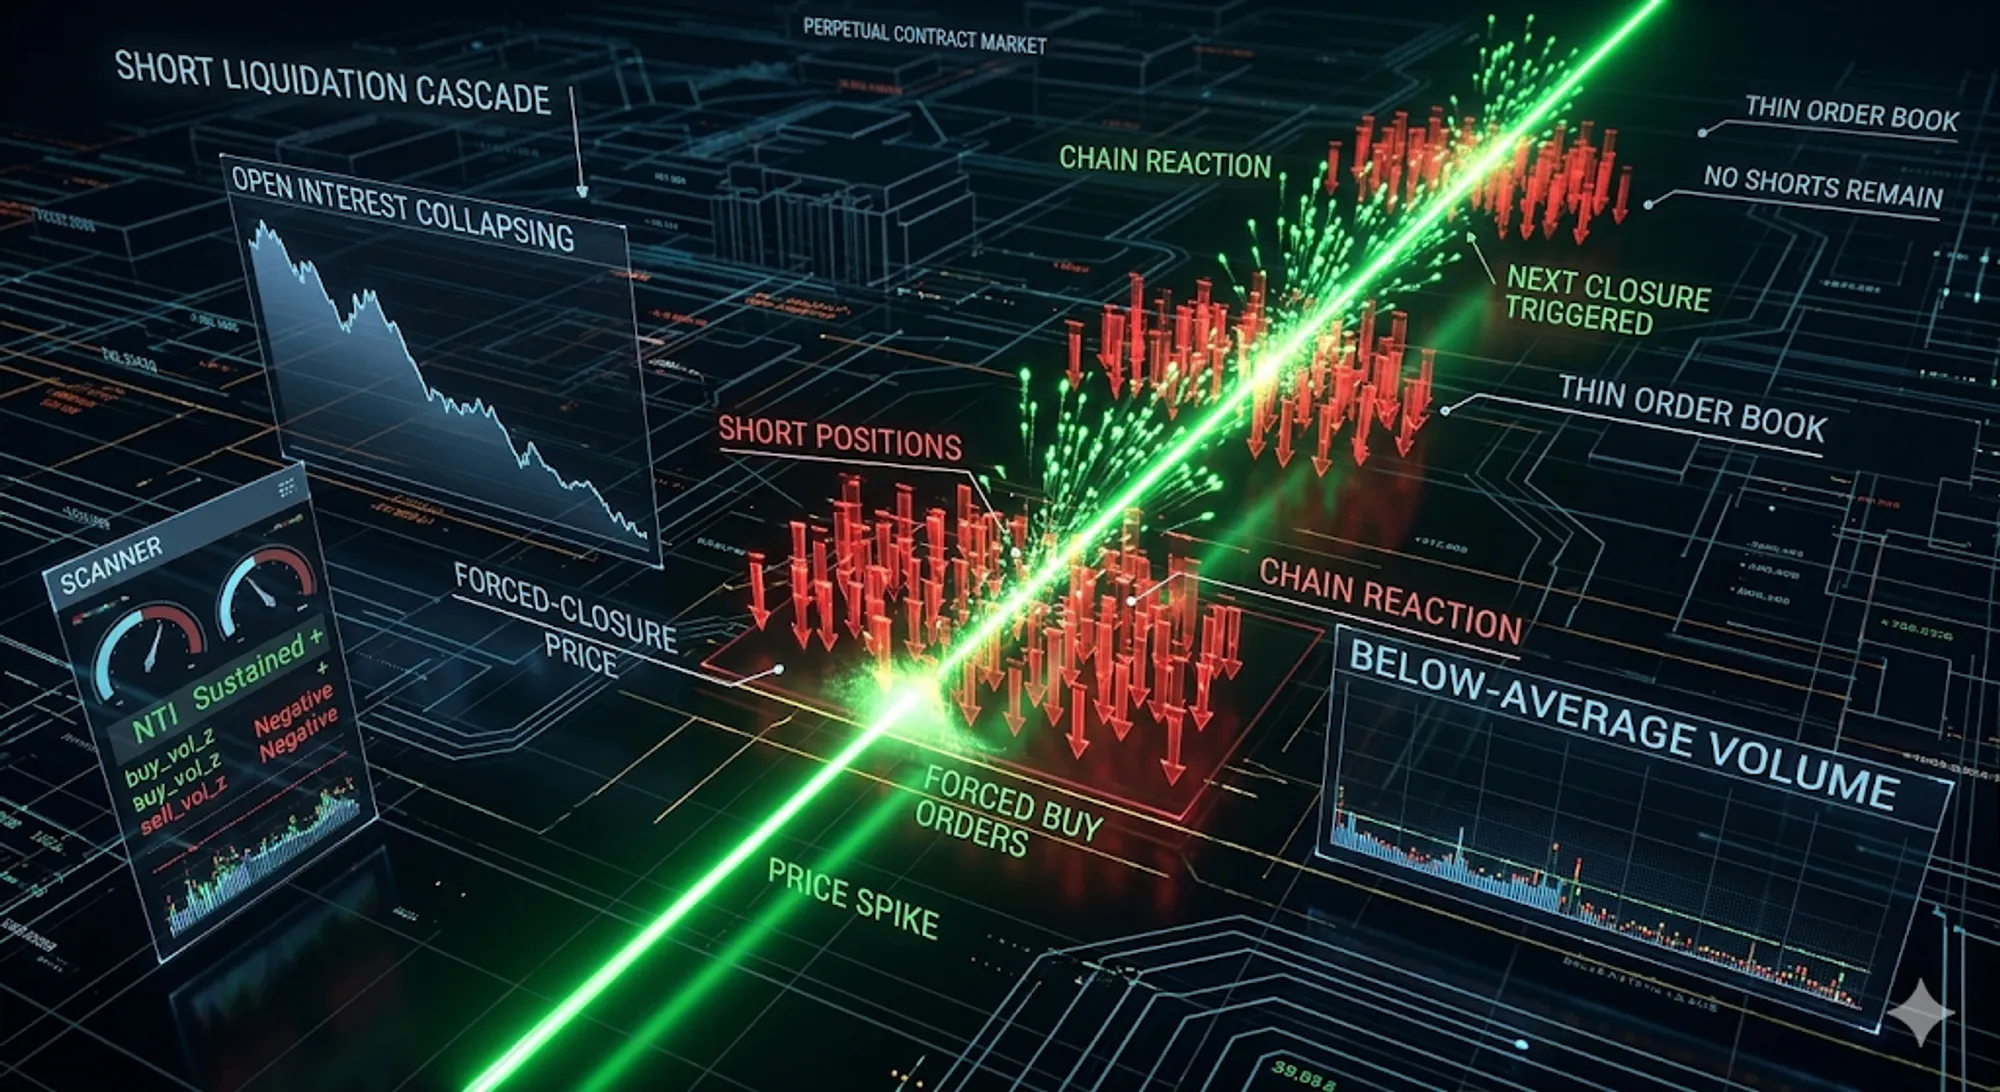
What is a short liquidation cascade? It is a sequence in which short positions are forced or pressured to buy back into a rising market, whether through formal liquidation, panic covering, or both. On a thin order book with sparse ask-side depth, even modest buy notional can sweep a wide price range. That pushes price into the next cluster of vulnerable shorts, which can trigger further covering. The result is a rapid price spike with falling open interest and outsized price impact relative to volume.
10:38–10:54 UTC: The setup alarm
Price ground upward through the 0.253–0.255 range, up 16% from the session open with no obvious momentum. Nothing notable on the surface.
The Deep Dive read differently.
| Time | Price | Relative Price Impact | Buy Volume Z-Score | 5m Open Interest Z-Score | 60m Net Taker Imbalance |
|---|---|---|---|---|---|
| 10:38 | 0.2527 | 9.12 | −0.24 | +1.64 | +5.96 |
| 10:46 | 0.2542 | 9.69 | −0.29 | +1.32 | +4.36 |
| 10:54 | 0.2545 | 9.00 | −0.37 | +1.32 | +5.45 |
Three readings in a row with Relative Price Impact above 9. Relative Price Impact at 9+ means price is moving roughly nine units per million dollars of volume. The book is structurally thin, not just momentarily disrupted.
The volume z-scores say the same thing in reverse. Buy Volume Z-Score is negative throughout. Volume is below the historical average. Price grinds up on below-average buying, and every buy order has outsized price impact because sell limit orders above are nearly absent.
Open Interest Z-Score (5m) is running at +1.3 to +1.6. OI is accumulating at above its historical average pace. New positions are opening faster than normal. The instrument is loading.
The 60m Net Taker Imbalance holds at +4 to +6. On the hourly timeframe, buyers are the dominant aggressive takers. Aggressive flow remains buy-dominant on the hourly window.
Thin book, elevated OI, below-average volume, hourly bullish taker regime. A small trigger can move price sharply because there is almost no sell-side depth to absorb it.
Put this on the watchlist.
11:55–12:02 UTC: The first spike. And the misread.
Price jumped from $0.296 to $0.336 in five minutes. OI dropped from 111.1M to 104.1M, a fall of −6.4%.
The standard interpretation: longs are taking profit. The move is extended. Be careful.
The indicators:
| Time | Price | OI | Buy Volume Z-Score | Sell Volume Z-Score | 5m Net Taker Imbalance |
|---|---|---|---|---|---|
| 11:54 | 0.296 | 111.1M | +0.18 | +0.44 | +1.12 |
| 12:02 | 0.324 | 104.1M | +0.08 | +0.27 | +2.65 |
Both Buy Volume Z-Score and Sell Volume Z-Score are near zero. Volume on both sides is at or below the historical average. Price still moved +9.5% in eight minutes and OI collapsed by 6.4%.
How does price move +9.5% on below-average volume?
The order book had signalled thin conditions for an hour via the elevated Relative Price Impact readings. When a cluster of short positions hit their liquidation price, the exchange engine sent forced buy orders to close them. Those buy orders hit sparse asks spread across a wide range above market. The liquidation engine swept through the entire range on a small notional amount.
A normal minute on this instrument might transact $16,000 in buy volume. The liquidation minute might have been $45,000. That is 2.8× normal, elevated but unremarkable on a z-score basis when averaged into the five-minute rolling window with four surrounding quiet minutes. The z-score stays near zero while price moves 9.5%.
Longs closing shows as elevated Sell Volume Z-Score: they are the sell-side taker, hitting the bid. What you see here is near-zero sell volume alongside near-zero buy volume and a collapsing OI. That pattern is consistent with short-covering pressure in a thin ask-side book, whether from forced liquidation flow, panic covering, or both.
Falling open interest does not identify which side ‘caused’ the move by itself. It only shows that existing long-short contracts were closed. In this case, the combination of a sharp price rise, weak displayed liquidity above market, and declining OI is consistent with shorts being forced to buy back into the ask, while the opposing resting liquidity came from participants reducing existing long exposure. That removes contracts and pushes OI lower.
12:02–13:26 UTC: The monitoring phase
After the first spike, OI sat at 104.1M. Price settled around $0.32–$0.34. The setup had either burned out or was reloading.

AnomIQ Deep Dive at 12:09 UTC, the start of the monitoring phase. The right panel is on the 5-minute timeframe.
The 5m Net Taker Imbalance is −5.4. Short-term sell pressure, longs booking profits after the spike. Bearish on the surface.
The 60-minute timeframe:
| Time | OI | 60m Net Taker Imbalance | 5m Open Interest Z-Score | 60m Open Interest Z-Score | Relative Price Impact |
|---|---|---|---|---|---|
| 12:06 | 104.2M | +3.80 | +0.52 | −0.15 | 3.14 |
| 12:22 | 107.1M | +4.02 | +0.52 | −0.15 | 5.05 |
| 12:46 | 108.4M | +3.88 | +0.26 | −0.02 | 6.94 |
| 13:02 | 110.1M | +3.88 | +0.26 | −0.02 | 4.95 |
| 13:18 | 111.9M | +3.52 | +0.26 | +0.43 | 1.46 |
| 13:26 | 112.1M | +3.50 | +0.48 | +0.43 | 4.83 |
The 60m Net Taker Imbalance held above +3.5 through the 84-minute consolidation. Buyers remained the dominant aggressive takers on the hourly. Aggressive order flow remained buy-dominant on the hourly window.
From 12:02 to 13:19, OI grew from 104M back to 112M, adding back 7.7% in new open positions. With 60m Net Taker Imbalance positive throughout, the dominant taker flow was buy-side. The combination of rising OI and positive Net Taker Imbalance is consistent with fresh long exposure entering against passive short-side liquidity. The passive counterparty was supplying the other side of the flow, but the data shown here does not identify whether that liquidity came mainly from market makers, hedgers, or discretionary sellers.
Directional reversal traders would show up as aggressive sell-side takers: elevated Sell Volume Z-Score, negative Net Taker Imbalance moving toward −20 or below. None of that appeared. Buy Volume Z-Score and Sell Volume Z-Score both stayed negative throughout the consolidation, total volume below average on both sides, consistent with a thin book and patient accumulation.
Two readings at 13:18 and 13:26 close the sequence:
At 13:18, the 60m Open Interest Z-Score crossed into positive territory at +0.43. OI was now growing at above its hourly historical average rate. Not just rebuilding, but accumulating faster than the instrument’s normal pace. The fuel pool was larger than at any point in the prior hour.
At 13:26, OI reached 112.15M, a new session high, exceeding the level that triggered the first squeeze. The 5m Net Taker Imbalance turned positive at +4.35 after sitting negative for most of the consolidation. Short-term momentum was resuming. Relative Price Impact was still at 4.83: the book had never recovered depth.
Eight minutes before the second spike, all five conditions were met simultaneously:
- OI at a new session high (maximum fuel loaded)
- 60m Open Interest Z-Score positive (fuel above hourly baseline)
- 60m Net Taker Imbalance persistently positive (bullish regime intact)
- 5m Net Taker Imbalance turning positive after consolidation (momentum resuming)
- Relative Price Impact elevated (book still structurally thin)
13:26–13:35 UTC: The second spike. And the exhaustion signal.
| Time | Price | OI | OI change |
|---|---|---|---|
| 13:26 | 0.340 | 112.1M | — |
| 13:28 | 0.360 | 108.8M | −3.0% |
| 13:31 | 0.376 | 107.2M | −1.5% |
| 13:33 | 0.490 | 105.2M | −1.9% |
| 13:35 | 0.437 | 92.7M | −11.8% |
Price went from $0.397 to $0.490 in sixty seconds, a +23.4% move in a single candle. It reversed to $0.437 in two minutes, and OI collapsed −11.8% in the following minute.
The volume z-scores at 13:34:
- Buy Volume Z-Score = −0.66
- Sell Volume Z-Score = −0.84
Both negative. The largest single-candle move of the entire session happened on below-average volume. The mechanism appears similar to the first spike, but larger: the thin book, now loaded with a fresh pool of long-biased positions and an even larger accumulated short interest from the OI rebuild, hit another liquidation trigger. The exchange engine swept through the sparse ask-side with a modest notional amount. Price moved 23% on less volume than an average minute.
At 13:35, OI dropped −11.8% in a single bar. That behavior is more consistent with cascade completion than with ordinary profit-taking. By 13:42, OI had fallen to 92.7M, down −17.3% from the 112M peak.
What the aftermath looked like
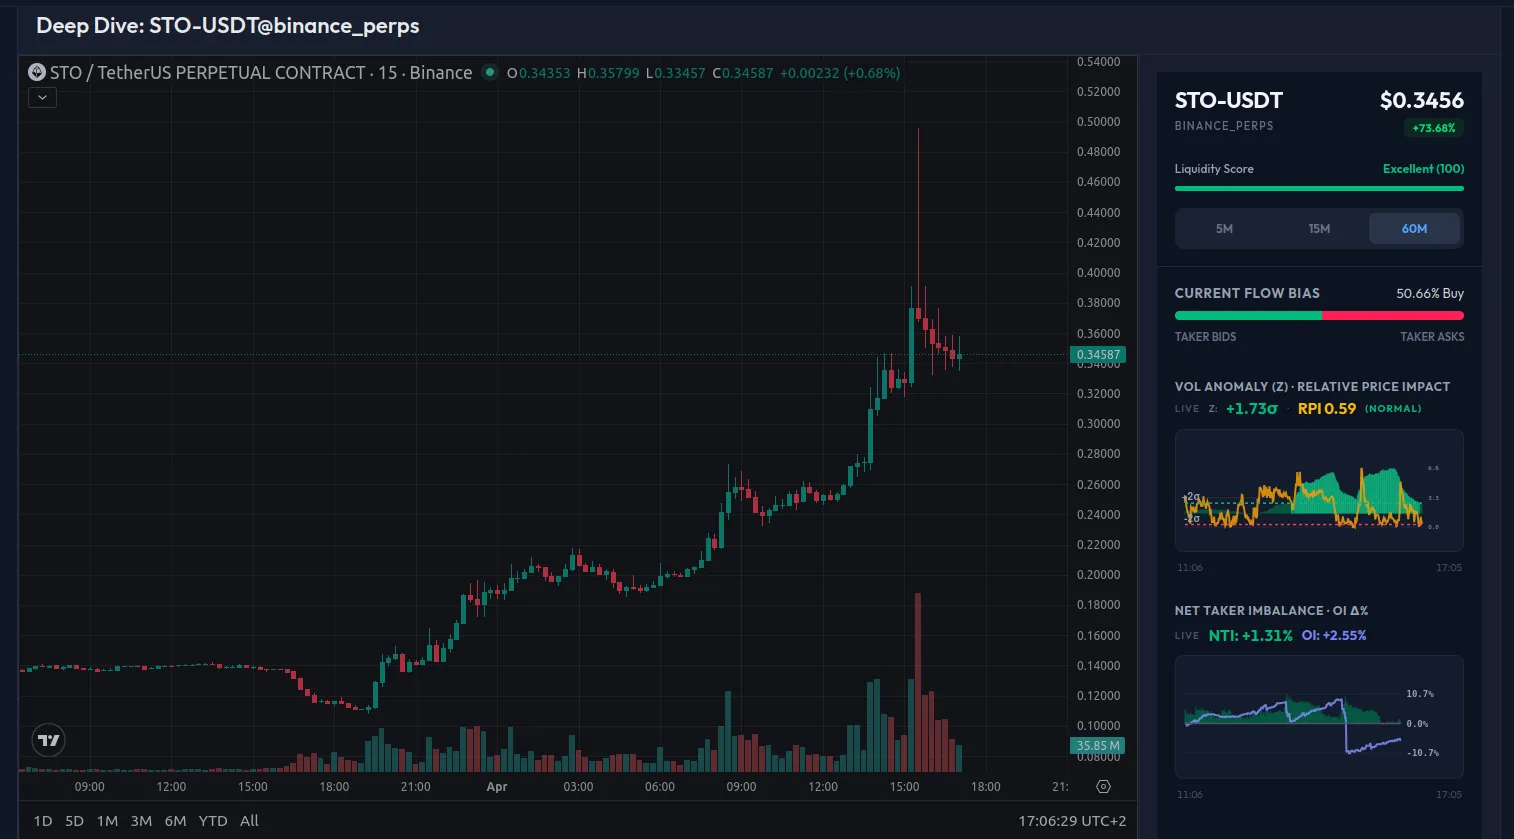
AnomIQ Deep Dive at 15:06 UTC, ninety minutes after the second spike.
Volume Z-Score: −1.73. Volume is below average, typical after a cascade discharges. The 60m Net Taker Imbalance has shifted to −10.4. The hourly regime that held +3.5 to +5.9 through the monitoring phase has flipped negative. The prior buy-dominant hourly regime is gone. Sellers are the dominant takers.
Relative Price Impact: 0.513. From the 9+ readings during the setup phase, to the 4–7 readings during the monitoring phase, to sub-1 in the aftermath. The book has recovered depth. No conditions for another cascade.
The five exhaustion signals, confirmed simultaneously
When the second spike peaked at 13:33, five conditions were met simultaneously:
- Price moved >15% in a single minute. That kind of pace is more consistent with unstable forced-flow dynamics than with orderly organic demand.
- Buy Volume Z-Score was negative (−0.66). The spike happened on below-average buy volume relative to baseline, which argues against broad demand-led participation.
- OI dropped during the spike. Positions closing, not new positions opening. The squeeze consumed fuel rather than accumulating it.
- Immediate hard reversal. $0.490 to $0.437 in two minutes (−11%). That suggests the move had little durable support at the highs.
- OI collapsed −11.8% in the next bar. That is consistent with the squeeze exhausting a large share of the remaining vulnerable positioning.
Any one alone is inconclusive. All five is the exhaustion signature.
Why Buy Volume Z-Score stays near zero during a liquidation cascade
The liquidation engine is placing buy orders. So why does Buy Volume Z-Score not spike?
Two reasons.
First: on a thin-book instrument, the absolute notional value of the liquidation orders can be small while the price impact is large. If the order book has gaps (no sell orders between $0.40 and $0.49), even a $5,000 buy order sweeps the entire range. The historical mean buy volume per minute might be $16,000. A $20,000 liquidation minute is 1.25× normal, barely above average in absolute terms.
Second: the z-score uses a five-minute rolling window average. Even if the liquidation minute contains elevated buy volume, it is averaged with four surrounding quiet minutes. A single minute at 3× normal becomes a five-minute average of 1.4× normal, which prints as 0.3–0.5σ. Unremarkable.
The cascade signature is a large price move with near-zero or negative Buy Volume Z-Score and falling OI. High move, low volume, falling OI.
Relative Price Impact is the structural precondition. When it has been elevated for an extended period, the book is thin enough for this to occur.
April 2: The pattern fires again, with a new layer
The session ended. The OI had collapsed from 112M to 87M. The 60m Net Taker Imbalance flipped to −10.4. By every exit condition in the framework, the trade was finished.
Eighteen hours later, STO-USDT was at $0.596 and the OI had rebuilt to 100.46M.
Someone had added roughly 13 million contracts of fresh exposure overnight. Given the subsequent behavior, a meaningful share of that new exposure was consistent with shorts leaning against the prior move.
The overnight rebuild
After the Day 1 exhaustion, the structural conditions had dissolved. Book depth had recovered. Regime had flipped negative.
But markets reset. The same instrument, the same dynamics. By 02:19 UTC on April 2, OI was 100.46M. The fuel pool had refilled above the previous starting point. The 112M OI that triggered the second squeeze on Day 1 was the session high, already higher than Day 1’s opening level.
The 60m Net Taker Imbalance at the April 2 open: +6.49. Hourly buyers were already dominant.
04:27–05:07 UTC: The absorption setup
For forty minutes before the explosion, the data looked bearish. It wasn’t.
| Time | Price | 5m Net Taker Imbalance | 60m Net Taker Imbalance | Sell Volume Z-Score | OI | OI% 60m |
|---|---|---|---|---|---|---|
| 04:27 | 0.589 | −2.62 | +5.91 | −1.16 | 97.65M | +1.08% |
| 04:35 | 0.611 | −9.33 | +5.99 | +0.48 | 97.78M | +0.37% |
| 04:43 | 0.614 | −10.26 | +5.42 | +2.64 | 98.81M | +1.97% |
| 04:51 | 0.623 | −3.29 | +5.50 | +2.67 | 99.35M | +2.25% |
| 04:59 | 0.625 | −4.46 | +5.30 | +2.03 | 99.60M | +1.64% |
| 05:07 | 0.633 | −2.84 | +5.86 | +1.57 | 99.81M | +1.78% |
The 5m Net Taker Imbalance reached −10.26. Sellers were hitting the bid aggressively on the short timeframe. Sell Volume Z-Score climbed to +2.64–2.67, well above average selling activity. A standard read: bearish pressure building, price likely to drop.
But price went from $0.589 to $0.633 across those forty minutes, up 7.5% while sellers pushed. The 60m Net Taker Imbalance never moved below +5.30. And OI was rising on the 60m timeframe by +1.97% to +2.25%.
Passive buy-side liquidity absorbed repeated aggressive selling. Demand filled each one without price yielding. Sellers could not move price because buy-side depth consumed their volume at the same level. Persistent aggressive selling without price damage, alongside rising OI, is consistent with fresh short exposure being absorbed into a stronger buy-side regime. The OI build is not concerning here, it signals the trap deepening.
Phase 1 of the scanner framework would be active across this window: Relative Price Impact elevated (2.4–3.1), 60m Net Taker Imbalance > +5, OI building on 60m, Sell Volume Z-Score elevated (indicating shorts loading).
05:07–05:55 UTC: The cascade
The trigger came at 05:11.
| Time | Price | OI | Open Interest % 5m | Buy Volume Z-Score | Sell Volume Z-Score | 60m Net Taker Imbalance | Relative Price Impact |
|---|---|---|---|---|---|---|---|
| 05:07 | 0.633 | 99.81M | −0.02% | +1.26 | +1.57 | +5.86 | 0.38 |
| 05:15 | 0.712 | 97.14M | −1.58% | −0.20 | −0.38 | +5.85 | 4.98 |
| 05:23 | 0.757 | 95.23M | −1.08% | −0.77 | −0.87 | +6.01 | 2.51 |
| 05:31 | 0.792 | 92.59M | +0.52% | −1.33 | −1.10 | +6.07 | 0.90 |
| 05:39 | 0.830 | 92.16M | −0.05% | −1.18 | −1.26 | +5.99 | 1.00 |
| 05:47 | 0.851 | 92.25M | +0.05% | −0.15 | −0.05 | +5.75 | 1.69 |
| 05:55 | 0.939 | 90.15M | +0.74% | −0.28 | +0.15 | +5.84 | 3.42 |
Price moved from $0.625 to $0.975 in 48 minutes: +56%. OI dropped from 99.60M to 90.47M: −9.2% (8.8 million contracts closed in under an hour).
Every volume z-score reading during the entire cascade was negative. Buy Volume Z-Score never exceeded −0.15. Sell Volume Z-Score never exceeded 0.15. The largest 48-minute price move in two sessions of data happened on below-average volume on both sides.
The 60m Net Taker Imbalance did not move. It held between +5.75 and +6.07 throughout the entire cascade. The 60m Net Taker Imbalance did not move. It held between +5.75 and +6.07 throughout the entire cascade. The buy-dominant hourly regime remained intact throughout the move.
Same pattern as Day 1, scaled up: thin book loaded with fresh short fuel, a liquidation trigger, a cascade sweeping through sparse ask-side liquidity on modest notional amounts.
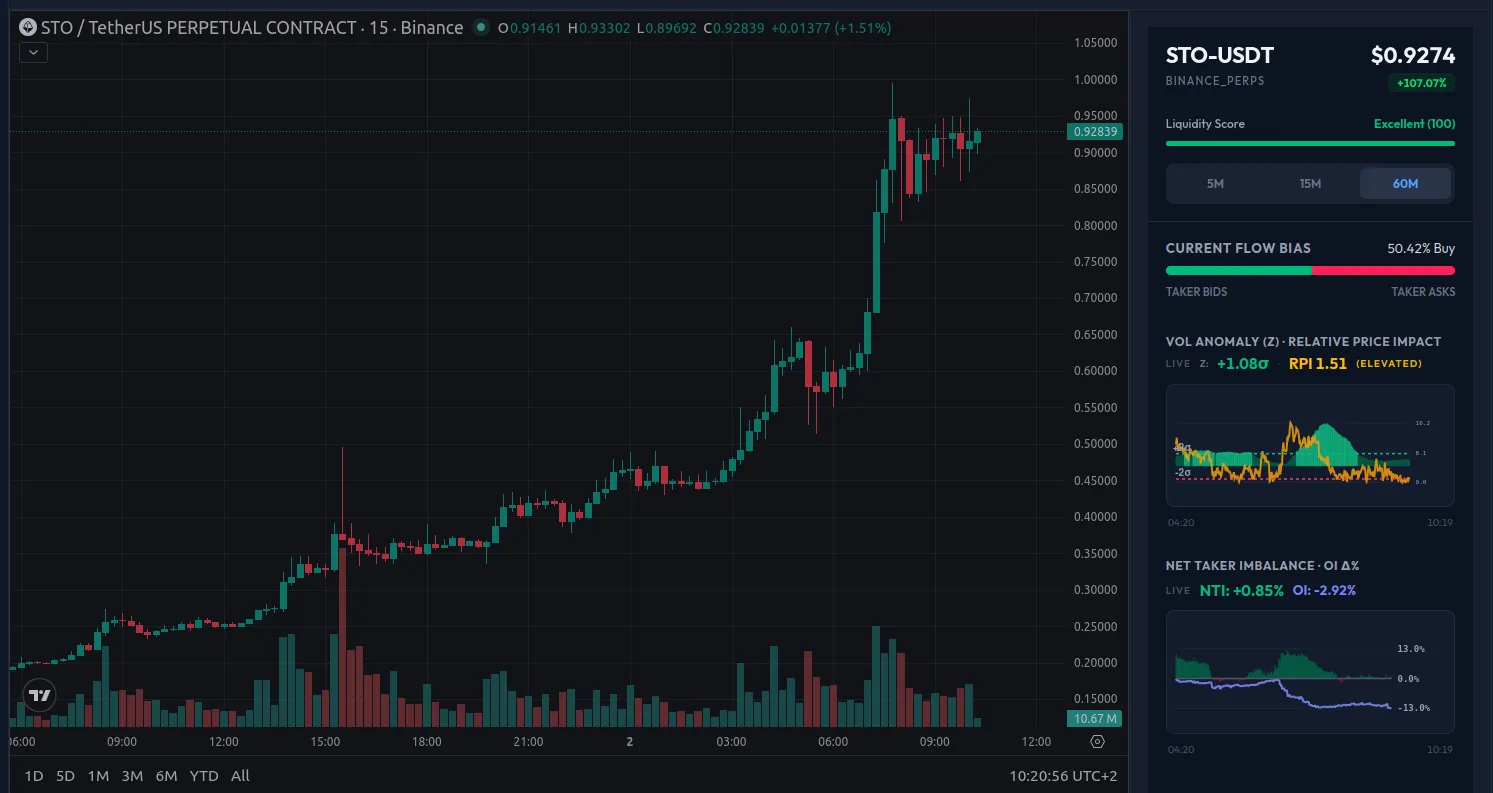
06:03–07:31 UTC: The rearm
After the spike peak at $0.975, price pulled back to $0.827 in eight minutes, a −15.2% reversal. On Day 1, the pullback was the end of the sequence: the 60m Net Taker Imbalance flipped negative, the regime died, the setup was over.
Day 2 was different.
| Time | Price | OI | Open Interest % 5m | 5m Net Taker Imbalance | 60m Net Taker Imbalance | Buy Volume Z-Score | Buy Volume Concentration |
|---|---|---|---|---|---|---|---|
| 06:11 | 0.850 | 88.43M | −0.34% | −7.77 | +5.82 | +0.10 | +0.18 |
| 06:27 | 0.858 | 87.99M | +0.34% | +6.79 | +6.69 | +2.26 | +0.69 |
| 06:35 | 0.881 | 88.00M | −0.04% | +5.48 | +5.43 | +1.84 | +0.82 |
| 06:43 | 0.888 | 88.10M | −0.12% | +9.25 | +5.93 | +1.30 | +0.62 |
| 07:07 | 0.914 | 88.76M | −0.33% | +12.54 | +6.01 | +3.64 | +1.78 |
| 07:15 | 0.914 | 89.34M | +0.01% | −1.53 | +5.78 | +3.27 | +0.87 |
| 07:31 | 0.913 | 89.04M | +0.57% | +2.88 | +4.71 | +2.35 | +0.37 |
Compare with the Day 1 aftermath. On April 1, after the second spike: 60m Net Taker Imbalance moved to −10.4, Total Volume Z-Score hit −1.73, book depth recovered, OI stayed depressed. Every indicator pointed to regime reversal.
Here: the 60m Net Taker Imbalance held at +5.4 to +6.7 through the entire pullback and consolidation. Buy Volume Z-Score turned positive and stayed elevated: +2.26, +1.84, +1.30, +3.64, +3.27, +2.35. Buy Volume Concentration reached +1.78 at 07:07: volume was concentrated in larger-than-normal buy trades, a concentrated buy-side accumulation pattern. OI held flat and rebuilt from 87.99M toward 89.34M.
The cascade appears to have cleared a large share of the vulnerable short exposure. What followed was a much healthier buy-side regime than the vacuum-driven move itself. The rearm phase from the scanner framework was firing: OI stabilizing, 60m Net Taker Imbalance sustained, 5m Net Taker Imbalance turning positive, Buy Volume Z-Score elevated with positive concentration.
The price eventually reached $0.974, a new session high on organic buy flow.
What made Day 2 different from Day 1
The exhaustion on Day 1 was complete. Five signals aligned simultaneously, the regime flipped, and the setup dissolved. Day 2 produced a similar-looking spike with identical Total Volume Z-Score and OI patterns, but one input differed: the hourly regime never reversed.
On Day 1, after the second squeeze:
- 60m Net Taker Imbalance: −10.4
- Total Volume Z-Score: −1.73
- Relative Price Impact: 0.51 (book recovered)
On Day 2, after the squeeze:
- 60m Net Taker Imbalance: +5.74 to +6.69 (never went negative)
- Buy Volume Z-Score: turned positive with concentration
- OI: stabilised and began rebuilding
The scanner framework handles this. The exit conditions require the regime to flip (Net Taker Imbalance (60m) < 0 for 3+ readings) or OI to collapse (drops >8% from peak AND Open Interest Z-Score (60m) < 0 for 2+ readings). On Day 2, neither condition was met after the cascade. The symbol would have stayed in the monitoring bucket. The rearm signal would have fired at 06:27 when 5m Net Taker Imbalance turned positive with elevated Buy Volume Z-Score.
The framework is not predicting direction. It is reading whether the structural conditions that enabled the first move have dissolved or regenerated. When they dissolve, exit. When they hold, stay attentive.
April 2: The afternoon session: vacuum mechanics and the collapse
Four hours after the morning squeeze, STO-USDT entered a different kind of move. The price had been grinding higher since the cascade, reaching the $0.90–$1.14 range by mid-morning. The next sequence would produce the largest single-session move in this three-day study: +90% peak-to-trough, then −71% in 29 minutes.
The afternoon session ran on different mechanics.
08:27–09:22 UTC: Setup into the spike
| Time (UTC) | Price | OI | OI % 60m | 5m Net Taker Imbalance | 60m Net Taker Imbalance | Buy Volume Z-Score | Sell Volume Z-Score | Relative Price Impact |
|---|---|---|---|---|---|---|---|---|
| 08:27 | $0.932 | 87.59M | −1.95% | +1.30 | +2.85 | −1.57 | −1.65 | 7.23 |
| 08:35 | $1.040 | 87.19M | −2.44% | +3.42 | +4.66 | −1.59 | −1.71 | 29.12 |
| 08:51 | $1.141 | 84.34M | −4.55% | +3.29 | +3.54 | −1.41 | −1.51 | 15.96 |
| 08:59 | $1.134 | 83.52M | −4.25% | +11.09 | +3.46 | −1.08 | −1.38 | 19.38 |
Three signals that distinguish this setup from the healthy morning session:
Both Buy Volume Z-Score and Sell Volume Z-Score are deeply negative throughout. On the morning cascade, Buy Volume Z-Score turned negative during the squeeze itself, a temporary artifact of the rolling window. Here, both Buy Volume Z-Score and Sell Volume Z-Score are negative from the first reading, ranging -1.41 to -1.71. The book is already nearly empty. Relative Price Impact at 29.12 at 08:35 confirms it. The morning cascade peaked at 7.49. A Relative Price Impact above 20 means the ask side has almost no depth: small order flow produces outsized price impact.
OI is contracting. The morning session showed OI rebuilding from 87.99M toward 89.34M during the rearm phase. Here, OI moves from 87.59M to 83.52M as price climbs from $0.932 to $1.134. Positions are closing into the rally. The shorts that remain are in a progressively thinning book.
The 60m Net Taker Imbalance regime is weaker. During the morning absorption, 60m Net Taker Imbalance reached +5 to +8. Here it peaks at +4.66 and holds between +2.85 and +4.66. Still positive, but below the sustained dominant-buyer regime that characterized the clean squeeze setup.
The 5m Net Taker Imbalance spike at 08:59 (+11.09) is an aggressive buy surge, a wave of market orders hitting the ask side. In a liquid book, this would print a price uptick and absorb. Here, with Relative Price Impact at 19.38, it hits near vacuum.
09:07–09:22 UTC: The spike
| Time (UTC) | Price | OI | OI % 60m | 60m Net Taker Imbalance | Buy Volume Z-Score | Sell Volume Z-Score |
|---|---|---|---|---|---|---|
| 09:07 | $1.265 | 82.73M | −5.17% | +3.36 | −0.89 | −1.05 |
| 09:15 | $1.505 | 79.53M | −6.65% | +3.41 | −0.47 | −0.68 |
| 09:22 | $1.772 | 72.88M | — | — | — | — |
$0.932 to $1.772 in under an hour: +90%. OI drops from 87.59M to 72.88M across the sequence, 14.7M contracts closed. With a near-empty book, each short closure forces the next short into a worse exit price, which triggers the next closure. This is consistent with a liquidity-vacuum regime rather than a healthy demand-led continuation.
A demand-driven rally shows positive and rising Buy Volume Z-Score. A liquidation cascade in a thin book shows Total Volume Z-Score hovering near zero or mildly negative as the rolling window adjusts across the spike. Here, Buy Volume Z-Score and Sell Volume Z-Score recover toward zero as the window adjusts, but neither goes positive during the move. The move does not show evidence of broad new demand relative to baseline volume. Price appears to have advanced mainly because the ask side was too thin to absorb even modest buy pressure.
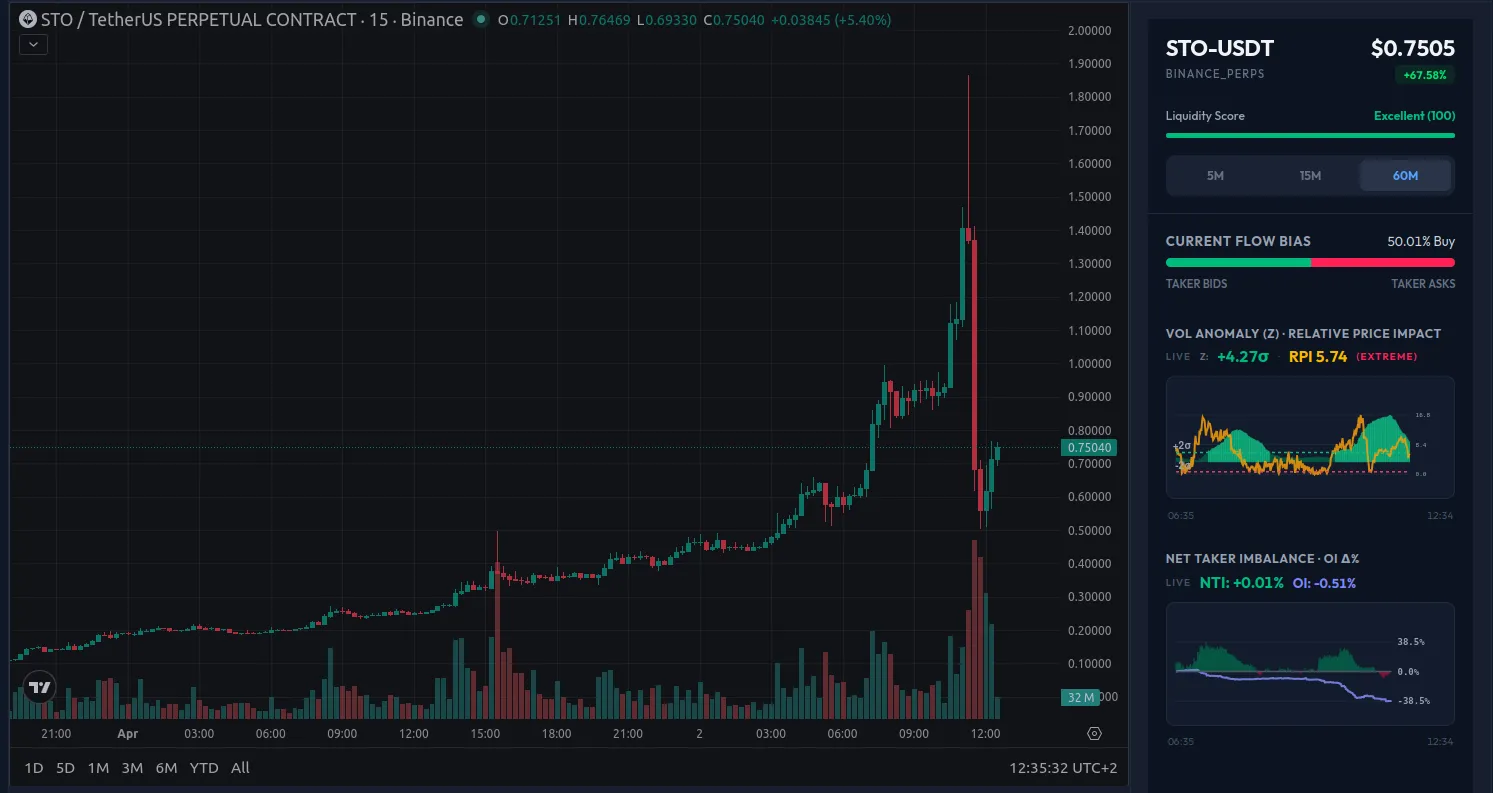
09:22–09:51 UTC: The crash
The crash is immediate and mechanical. From the $1.772 peak:
- $1.772 → $0.520 in 29 minutes
- Price decline: −70.7%
- OI: 72.88M → 60.09M (−17.5% in the crash leg alone; −38% from the session start at 97.78M)
The crash was proportional to the spike because the same fragile-liquidity conditions worked in reverse. The spike was vacuum-driven: participation was weak relative to baseline, the book was thin, and short covering appears to have been a major contributor to the move. Once forced or urgency-driven buying faded, downside liquidity became fragile. With much of the vulnerable short exposure already cleared, the market no longer had the same support from forced buy flow.
The Relative Price Impact screenshot at the $1.505 level shows 29.7%. That reading, during an upward move, is a flare: the market is one order away from free-fall in either direction.
The post-crash paradox
After the −70.7% collapse, the 60m Net Taker Imbalance posted the highest readings in the entire three-day sequence:
| Time (UTC) | Price | 60m Net Taker Imbalance | 60m Buy Volume Z-Score | 60m Buy Volume Concentration |
|---|---|---|---|---|
| 09:51 | $0.520 | +8.27 | +1.18 | — |
| 10:02 | $0.578 | +8.56 | +1.42 | — |
| 10:18 | $0.620 | +8.83 | +1.74 | +1.31 |
| 10:34 | $0.652 | +8.27 | +1.18 | — |
Discretionary buyers appear to have entered at crash lows. The $0.52 price attracted genuine demand: Buy Volume Z-Score positive, Buy Volume Concentration elevated (larger buy trade sizes), 60m Net Taker Imbalance at +8.27 to +8.83. That behavior is more consistent with discretionary buying at distressed prices than with residual forced-cover flow. The regime turned buy-dominant for the first time in the afternoon session.
The strongest buy-side reading in three days appeared at the price bottom, 35 minutes after the crash. The scanner reads this as a rearm. But a post-vacuum recovery and a pre-squeeze setup produce the same surface metrics. The structural conditions underneath are different.
Three setups, three outcomes
| Session | Relative Price Impact at setup | 60m Net Taker Imbalance at setup | Both buy/sell Volume Z-Score negative at setup | OI trajectory | Outcome |
|---|---|---|---|---|---|
| Apr 1, 10:38 | 4.20–5.75 | +4.2 | No (Buy Volume Z-Score positive) | Building | Short squeeze → continuation → exhaustion |
| Apr 2, 06:03 | 3.93–5.77 | +5.0–+8.0 | No (Buy Volume Z-Score turns negative during cascade) | Building, then rebuilds | Short squeeze → genuine continuation |
| Apr 2, 08:35 | 7.23–29.12 | +2.85–+4.66 | Yes, throughout | Contracting | Vacuum spike → immediate collapse |
In this case study, the most useful distinguishing variable was whether both Total Volume Z-Score readings were simultaneously negative before the spike fired. Net Taker Imbalance direction alone was not enough.
When only Sell Volume Z-Score goes negative during a squeeze (sellers absorbed, buyers dominant), the spike is mechanically clean: liquidations into a book with genuine demand. When both go negative during the setup phase, the book is more likely hollow than healthy. That points toward vacuum-style mechanics rather than a cleaner squeeze structure. In this sample, those moves were larger and mean-reverted faster.
The core principle
The price spike is the last thing to look at. By the time it is visible, the information has already been spent.
Relative Price Impact, Open Interest Z-Score, and 60m Net Taker Imbalance define the structural conditions that make a spike possible. OI rebuild, 60m Open Interest Z-Score, and Net Taker Imbalance regime persistence show whether the fuel is reloading or dissipating. Negative Buy Volume Z-Score during a spike and OI collapse mark when the move is done.
April 1: the setup was visible at 10:38, and the second squeeze arrived at 13:33. The indicators tracked the regime for 175 minutes without needing to predict the exact trigger.
In every case, the price move itself was the last signal. What mattered was the state of the book before it happened.
The Deep Dive panel in AnomIQ shows all of this live: Relative Price Impact, Open Interest Z-Score, Net Taker Imbalance, and Total Volume Z-Score across three timeframes, for every instrument the scanner tracks. Three sessions. Across all three sessions, the structural conditions were visible before the largest price expansions. The exact trigger was not predictable; the regime was.
The scanner filters described in this post are available as preset configurations in AnomIQ. The deep dive view shown in the screenshots is part of the standard dashboard for all plan tiers.