
Daily High/Low Bounce Trading Strategy for Crypto

Trader turned software engineer, with 4+ years building systems for crypto exchanges. Founder of AnomIQ, a real-time crypto anomaly scanner for quantitative traders.
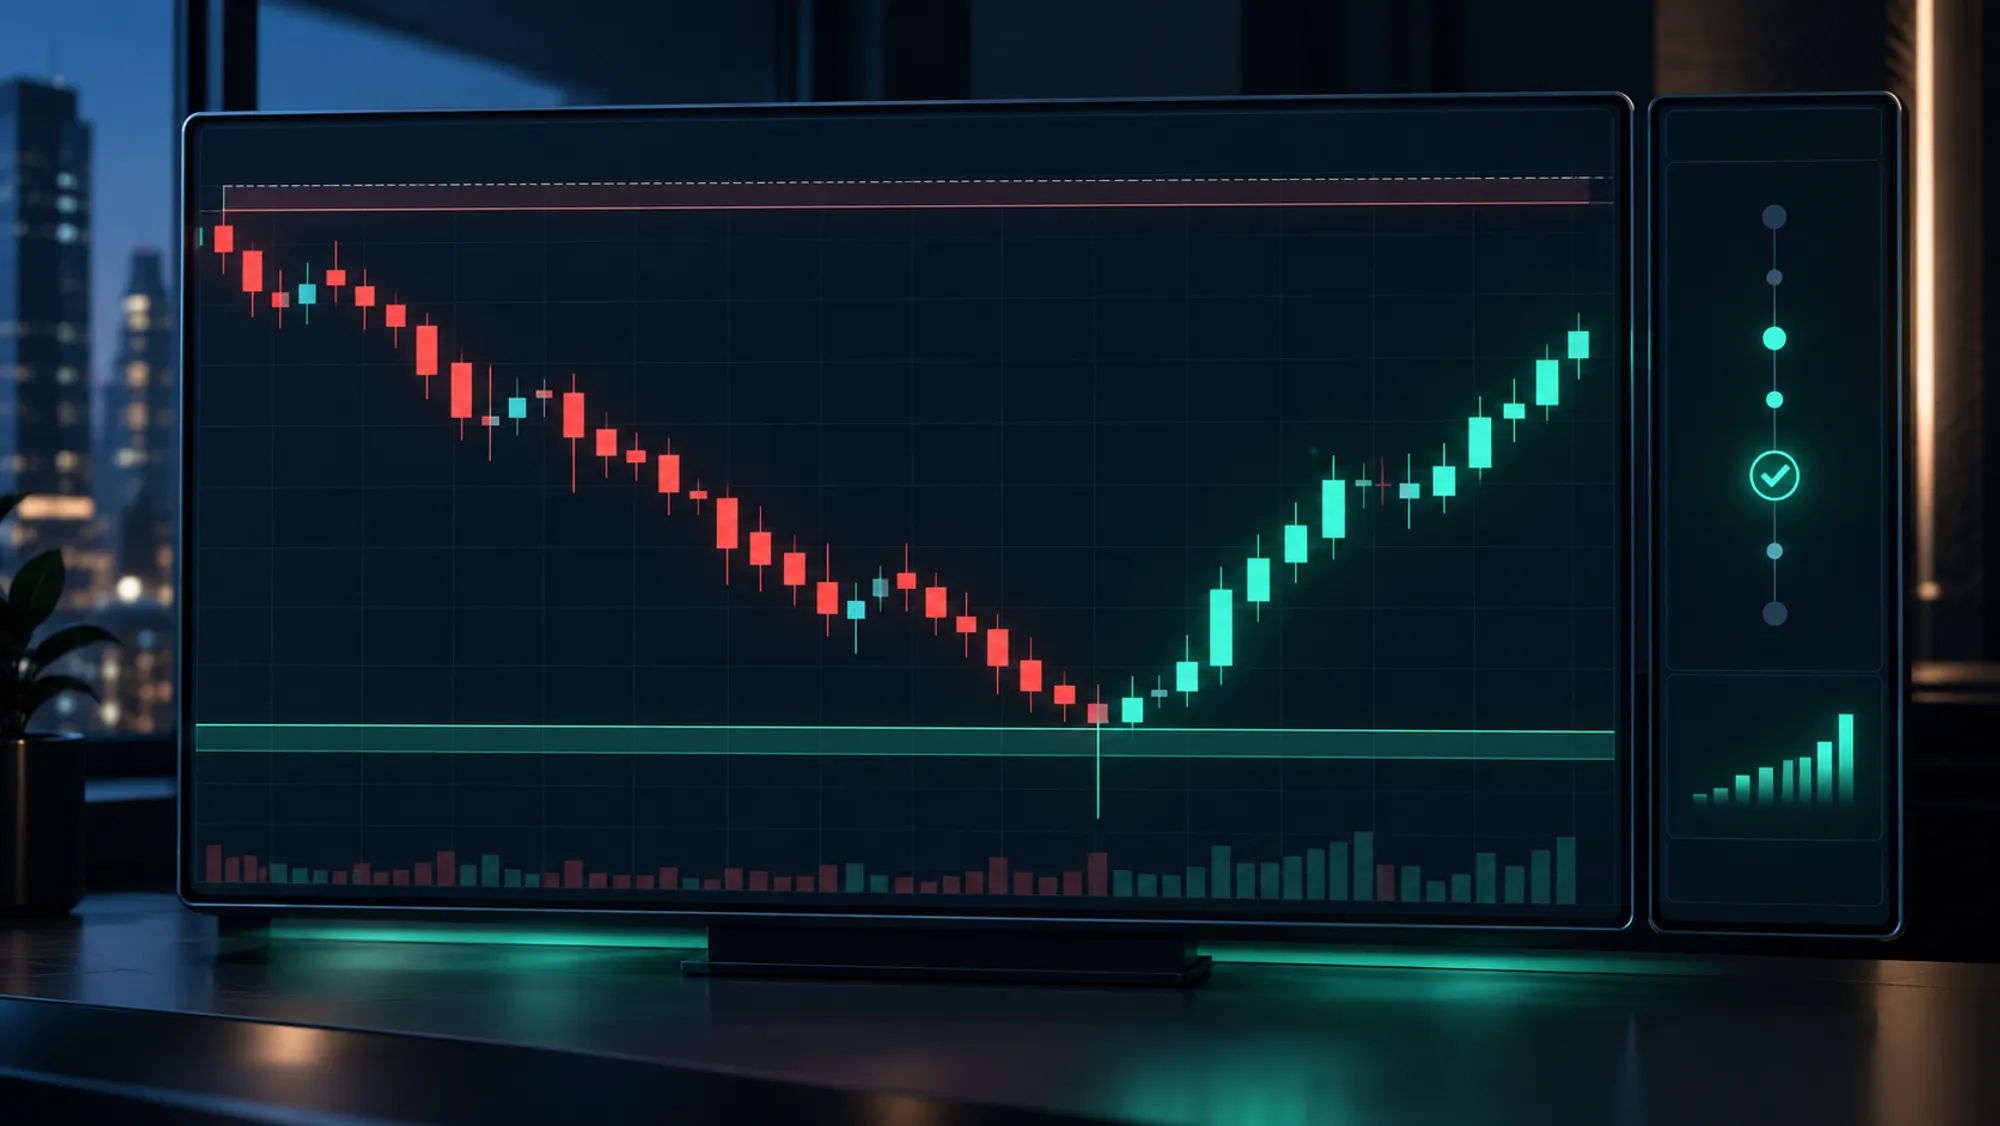
Daily high/low bounces in crypto trading come down to trapped traders re-engaging when price returns to yesterday’s extremes. A bounce fires when two conditions collide: price tests the prior day’s high or low (within 0.3%), and the current timeframe shows recovery (2-3%+ return). Both conditions together separate real bounces from noise.
You identify these setups manually by checking yesterday’s range on any chart. You execute them with hard stops and defined targets. You scale them with automation across hundreds of markets to catch the 15 daily setups you were missing while staring at 2.
This is Article 1 of a 3-article cluster on daily high/low detection and bounce trading. Part 2 covers advanced metrics and volume profile layers; Part 3 is a practical trading system combining multiple signals.
Key Takeaways
- Daily highs and lows are where the most volume traded yesterday; traders re-engage when price returns to them.
- A bounce fires when: price hits today’s high/low zone (within 0.3%) AND the current timeframe shows recovery (2-3%+ return).
- Entry happens on the recovery candle; exit at the prior-day high or on break of the level. Risk no more than 1-2% per trade.
- Manual bounce detection across hundreds of coins is impossible. Automation lets you monitor the setup at scale without chart-staring.
- AnomIQ’s daily high/low bounce filter detects when price approaches these levels with recovery confirmation across 200+ markets in real-time.
What Are Daily Highs and Lows (and Why Traders Care)
The previous day’s high and low are the extreme price points from the prior complete UTC day. If BTC’s high yesterday was $65,200 and its low was $63,800, those prices carry structural weight because they represent moments when participants made commitments at scale. AnomIQ tracks these asNew UTC Day High and New UTC Day Low — the foundational levels for bounce detection.
When you see a high concentration of volume at a price level, market participants remember it. If you bought at that level and it fell below your entry, you are underwater. If price returns to that level, you often re-enter to reduce losses or add to positions. If you sold at that level and it continued lower, you protect that profit by setting a stop above it. The level becomes a magnet: participants watch it, set orders around it, and react when price gets close to it.
This is not theoretical. Volume profile research consistently shows that high-volume nodes attract re-engagement. The previous day’s high and low are almost always high-volume nodes because they represent turn points or rejection zones from the last complete session.
Why Bounces Happen at Daily Highs and Lows
Three mechanical forces collide to create bounces:
1. Trapped Traders
A trader who bought at yesterday’s high and watched price fall all day is now holding a losing position. If price returns to that high tomorrow, they see one thing: escape hatch.
They set sell orders waiting for it. The moment price approaches, you get a wave of selling from these trapped longs. Same thing happens in reverse at the low — traders who shorted at the low and watched price recover see a chance to cover. They buy frantically when price approaches the low again.
This is human behavior, not algorithmic. And it’s consistent enough to trade. The trapped trader is predictable.
2. Structural Support and Resistance
In technical analysis, a prior session’s low acts as support for the new session, and a prior high acts as resistance. The psychology is simple: if the market tested that level yesterday and bounced, it’s likely to test it again and react the same way.
This doesn’t always work. Support breaks. But the structure is real enough that professionals plan their orders around it.
3. Thinning Liquidity at Extremes
Price extremes (the prior day’s high and low) often have lower passive liquidity — fewer limit orders sitting to absorb market-order volume. When price approaches, aggressive orders can move price quickly in either direction. A small amount of buying pressure can push price up through the high; a small amount of selling can push it back down. That volatility attracts scalpers and traders looking for quick reversals.
How to Identify Daily High/Low Levels Manually
Pull up any crypto chart on TradingView or your exchange. Set the timeframe to the 1D (daily). The highest price the coin reached during yesterday’s candle is the prior-day high. The lowest price is the prior-day low.
Write these down or set price alerts on them.
For BTC, if yesterday’s range was $64,000 to $66,000:
- Prior-day high: $66,000
- Prior-day low: $64,000
- Today, watch for price to approach one of these levels
The reason this is so simple is also the reason it’s so easy to miss at scale. Tracking one or two coins by hand is manageable. Across 50 coins, you need 50 separate alerts. Across 200 coins, manual tracking becomes invisible. Most traders only watch the handful of coins they already follow, and miss the setups on everything else.
The Real Bounce Signal: Distance + Recovery
Here’s where most bounce traders get it wrong. They see price touch the prior-day low and enter immediately. That’s premature. What separates a real bounce from a fake-out is simple: recovery.
A real bounce has two components:
Component 1: Distance to Today’s High/Low
Price must actually test the level — not just get close.
Definition: Price is within 0.3% of today’s high or today’s low.
Why 0.3%? That’s close enough to trigger the trapped traders and institutional orders sitting at the level, but specific enough to filter out noise. On a $65,000 BTC level, 0.3% is $195. Close, but not random.
Component 2: Current Timeframe Return
Price must show recovery — not collapse further.
Definition: The current 5-minute or 15-minute candle return is positive, typically 2-3%+ on the first candle after the level test.
Why this matters: If price hits the daily low but the current candle closes down -1%, that’s a breakdown, not a bounce. If price hits the daily low and the current candle closes up +3%, trapped traders are covering and buyers are stepping in. That’s a bounce forming. For advanced traders: this recovery candle is where absorption typically shows up. High volume with limited price progress gets replaced by directional volume with clear upward movement.
Mechanical Entry Rule: Distance + Recovery
Once both components align, execution is simple:
Entry Signal
When price:
- Tests today’s high or low (within 0.3%), AND
- Current timeframe candle returns 2-3%+ (recovery)
Enter a long position on the close of the recovery candle, or on a breakout above it.
Real Example:
- BTC’s today low: $64,000
- Price drops to $64,080 (within 0.3%)
- Current 5-minute candle: opens at $64,100, closes at $65,020 (+1.4%)
- Not quite 2% yet. Wait.
- Next 5-minute candle: opens at $65,020, closes at $66,100 (+1.66% on the candle)
- Total recovery from low: +3.2%
- Entry: Long at $66,100 or on next breakout
Exit (Profit Target)
The first profit target is the prior-day high. If the prior-day high was $66,000 and you entered a long bounce at $65,000, your first target is $66,000.
If the bounce reaches that level, take some profit (half the position or more). If it breaks through, you can trail a stop-loss or hold for the next resistance level.
Exit if price closes below the level you entered at. The bounce reversed, and it’s time to accept the loss and move on.
Risk Management: Protecting Your Account
Bounces fail. Support breaks. Your thesis on recovery can be wrong. Here’s how to survive:
1. Use Hard Stops, Not Mental Stops
A mental stop is a price level you tell yourself you’ll exit at. But when price touches it, fear or hope overrides your decision, and you hold. Then price keeps falling, and you suffer a much larger loss than you planned.
A hard stop is a limit sell order placed when you enter. If you enter a bounce trade, immediately place a sell order 1-2% below your entry. When that price is hit, the order executes automatically. You don’t have to make another decision.
2. Scale Out of Winning Trades
If your bounce target is the prior-day high, sell half your position at that level and let the other half run. You lock in a win and reduce risk.
If you entered 2 BTC, sell 1 BTC at the prior-day high. Now your worst-case loss on the remaining 1 BTC is zero, because you’ve already made profit. The remaining 1 BTC is a free play.
3. Risk No More Than 1-2% Per Trade
Risk no more than 1-2% of your account per bounce trade. (This is where most traders fail. They risk 5% or 10% because the setup feels obvious. It never goes well.)
If your account is $10,000, your limits are:
- 1% risk = $100 max loss per trade
- 2% risk = $200 max loss per trade
Walk through a real example: you enter at $65,000 with a stop at $64,850. Your risk per Bitcoin is $150. That’s 1.5% of a $10,000 account on one BTC.
The rule: Never risk more than 2% per trade, no matter how confident the setup looks. The ones that feel obvious are often the ones that reverse on you.
Why Bounces Trap Traders in Downtrends
The single biggest mistake bounce traders make is not checking context.
In an uptrend (higher highs and higher lows), bounces off the prior-day low work 70% of the time. A recovery candle in an uptrend signals buying interest, and price usually continues higher.
In a downtrend (lower highs and lower lows), that same bounce is often a trap. Price approaches the prior-day low, recovery candle forms, traders enter longs expecting a bounce, and then price falls through the low and continues downward. The “bounce” was just profit-taking on a short-term rally inside a larger downmove.
Before trading any daily high/low bounce:
- Check the 4-hour or daily chart for trend direction
- If price is in a clear downtrend with lower highs and lower lows, skip daily-low bounces (wait for resistance instead)
- If price is in an uptrend, daily-low bounces are high-probability
Context converts a random price touch into a high-conviction setup.
Common Mistakes Traders Make
Mistake 1: Entering Before Recovery
Price touches the prior-day low. It’s right there. You want in.
But wait. Is there a recovery candle yet? Is the current timeframe showing +2-3%? Or are you just staring at a price touch with hope?
Most traders enter here. Price falls through the level 2 candles later. They get stopped out, frustrated, and swear off the setup forever.
The cost of waiting one candle is minimal. The cost of entering early is usually your stop-loss. Wait for the recovery signal.
Mistake 2: Ignoring Liquidity
A small-cap altcoin with $50K daily volume has a prior-day high and low, sure. But when you enter a bounce with a market order on thin liquidity, your order moves price 1-2%. That’s not edge. That’s slippage eating your profit target.
Add a liquidity floor: only bounce trade coins with $500K to $1M daily volume or higher (adjust based on your position size). This single filter cuts your losing trades significantly. AnomIQ’s Liquidity Score metric measures this directly — filter by a minimum Liquidity Score to prevent chasing setups on coins with invisible bid-ask spreads.
Mistake 3: Holding Too Long (Greedy Exits)
Bounces are fast. You enter the recovery candle, price rallies into the prior-day high, and you watch it. “Maybe it’ll break through. Maybe 5%…”
Bounces tend to reverse sharply — often back through your entry in just 5-15 minutes on the 5-minute chart. You get caught holding the wrong side.
Take profit at the prior-day high target. A 2-3% win is not leaving money on the table. It’s following your plan.
Mistake 4: Mixing Levels
The prior-day high and low are one type of level, but they’re not the only ones. Round numbers like $65,000, a swing high from three days ago, a moving average — these are all potential bounce points too.
The problem: a bounce off a round number has lower conviction than a bounce off a daily high/low that’s been tested multiple times. Learn the difference. Not all structural levels are equal.
Why Manual Bounce Detection Doesn’t Scale
Here’s what you’re good at now: identifying daily high/low bounces manually. You know the distance metric. You know to wait for recovery. You could probably walk up to a chart, see the setup, and execute a trade correctly.
On one or two coins? Perfect.
But let me ask you something: how many crypto pairs are actually worth trading? There are 200+ liquid pairs across major exchanges right now. Yesterday, probably 15 of them formed textbook daily high/low bounce setups. Distance to level + recovery signal. Clean entries, easy targets.
You weren’t watching all 15. Most likely you saw 2 or 3. Which means you missed 13 setups that would have hit your target.
This is the retail trader trap. You know how to trade bounces. You just don’t see them. You’re not bad at trading; you’re drowning in choice.
The traders who make consistent income from bounces aren’t smarter than you. They just don’t stare at charts. They set up automation to surface the setups, then they execute:
- Automation watches 200+ markets for the pattern (distance + recovery)
- Alert fires the moment conditions are met
- They spend 30 seconds confirming the chart
- They execute
Manual chart-staring can’t compete with this workflow. Advanced traders layer in order flow scanning at the bounce point — confirming the distance + recovery with directional aggression data — but the core signal is still price + distance.
Scaling Bounce Detection: Real-Time Automation
A real-time scanner watching daily high/low distance and recovery across hundreds of markets can surface every tradeable bounce setup the moment it forms. Instead of checking charts manually, you get a notification: “BTC tested today’s low at $64,000 (within 0.3%). Current 5m candle: +3.2% recovery.”
That one alert tells you:
- What to look at (BTC, not 50 other coins)
- Why now (level test + recovery forming)
- When to act (before the move extends further, while risk/reward is tight)
Then you spend 30 seconds checking the 5-minute chart to confirm trend context. If price is in an uptrend and the recovery is real, you enter. If you see signs of a downtrend, you skip it.
Real-time high/low detection with recovery confirmation transforms bounce trading from a hobby you fit around chart-watching into a scalable, repeatable process. For traders who want to add a conviction layer, Net Taker Imbalance at the bounce point confirms that aggressive buyers are stepping in, not just price momentum alone.
Conclusion
Daily high/low bounces work because humans are predictable. Price tests a level, traders react, you catch the reversal. It’s not complicated.
The mechanical signal isn’t complicated either: price within 0.3% of today’s high/low + current timeframe return of 2-3%+. Enter on the recovery candle, exit at the prior-day high or on break of the entry level. If your context is right (uptrend, not downtrend) and your discipline is tight (hard stops, no revenge trading), this setup will work.
The catch is scale. You can trade bounces on a handful of coins you watch by hand. But most of your edge gets left on the table — in the setups on coins you’re not looking at.
The traders making real income from bounces aren’t trading better. They’re just monitoring better. They use automation to surface the setups across hundreds of markets, confirm the chart with their eyes, and execute.
So here’s the question: Are you going to keep hunting charts manually, catching maybe 2 out of 15 daily bounce setups? Or are you going to let a scanner do the discovery and spend your time on execution?
Open AnomIQ and set up your first daily high/low bounce filter. You’ll be able to scan for price within 0.3% of yesterday’s high or low across 200+ markets in real-time. Layer in the recovery confirmation — current timeframe return threshold — and the scanner surfaces only high-conviction setups. The scanner does discovery. You confirm and execute.
Free tier, no credit card. Go build your first daily high/low bounce scanner. The setups are there. You’re just not seeing them yet.