Early Signs of a Potential Short Squeeze: RAVE-USDT Case Study
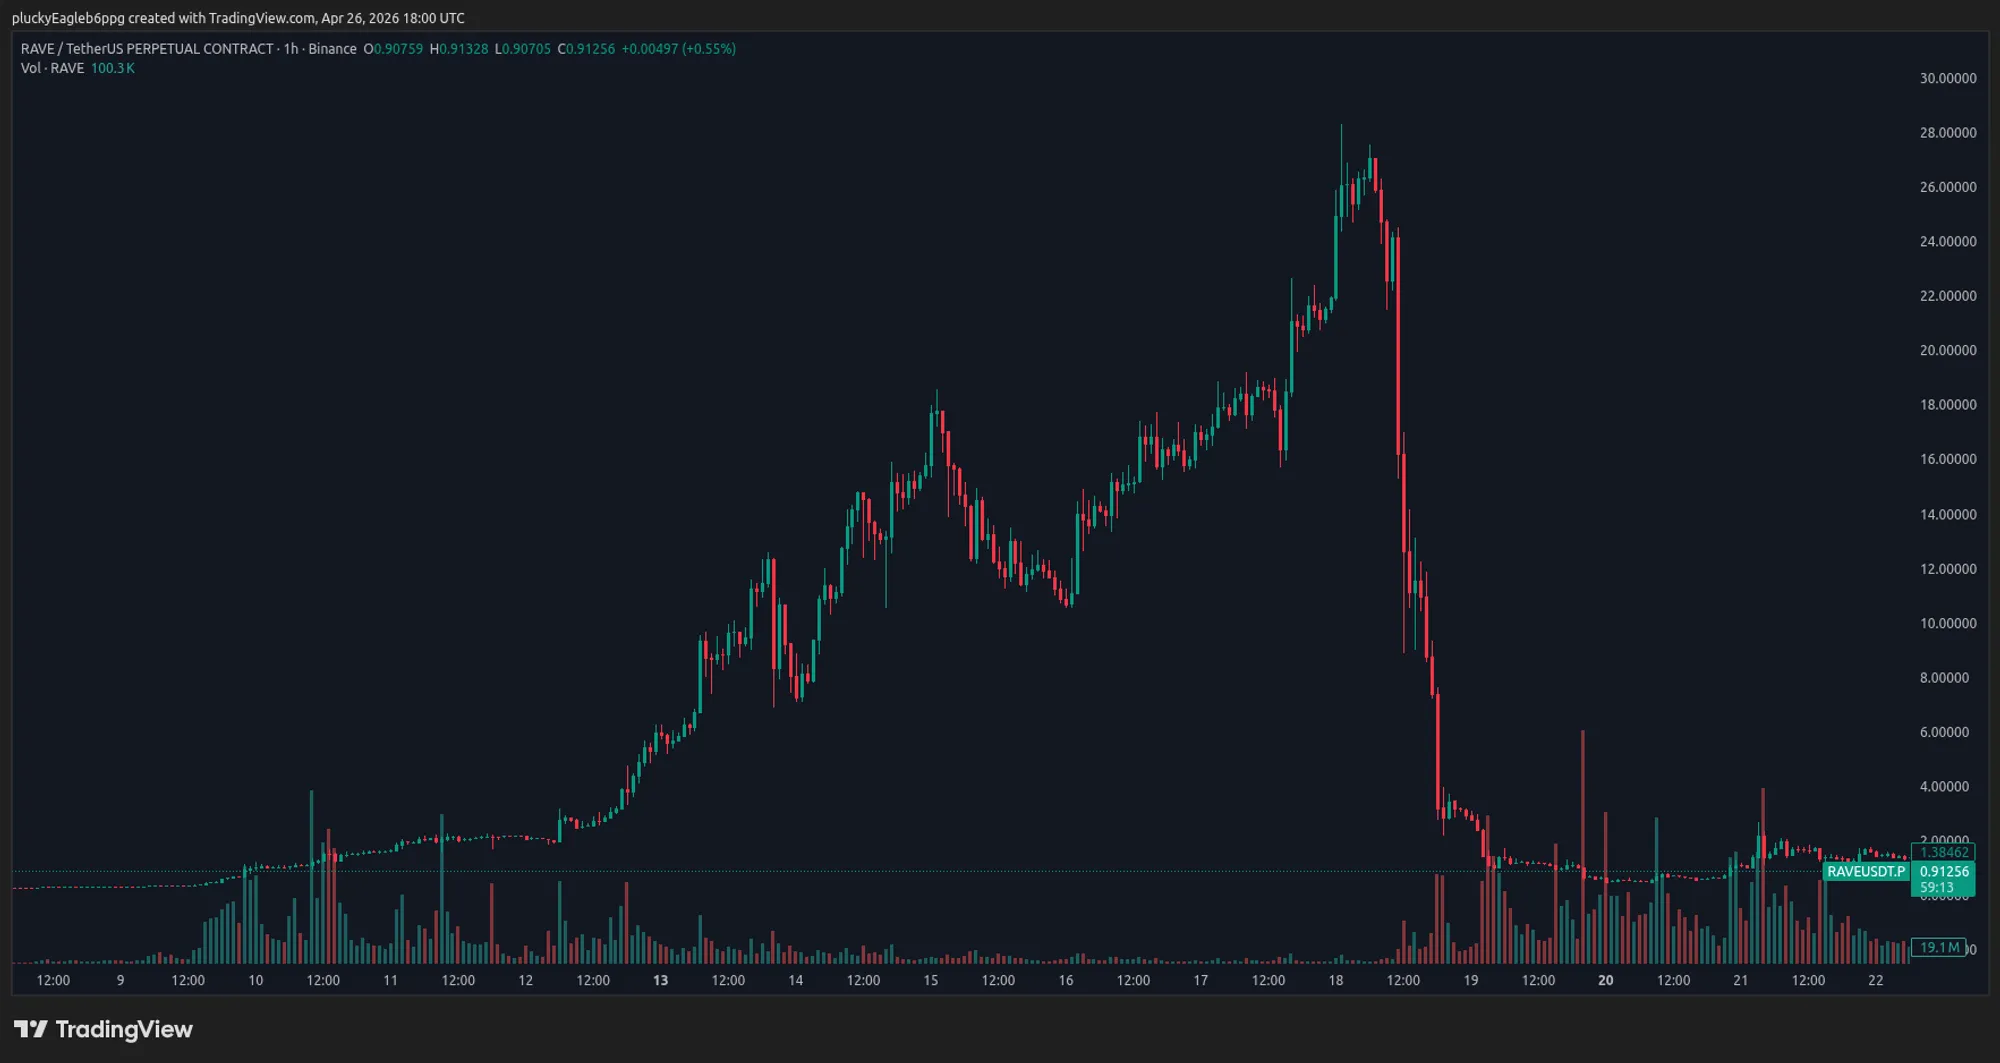
RAVE-USDT moved from $0.247 on April 7 to $28.00 on April 18.
The useful question is what showed up before the move became obvious.
The scanner was already flagging abnormal order-flow readings on April 7 and April 8. Those alerts mattered because they showed pressure building early. On their own, though, they did not yet describe a clean squeeze setup.
That is the difference between an alert and a trade thesis. An alert tells you something unusual is happening. The next step is context: who is pressing, who is absorbing, whether price is moving freely, and what open interest is doing.
A one-line rule would have been too blunt:
Buy Volume Z-score > 10
It would have fired before the real move. It also would have fired during events that produced almost no sustained price movement.
The useful read came from structure:
- extreme readings stopped appearing in isolation,
- buy-side flow became more directional and more concentrated,
- Relative Price Impact started rising before the biggest displacements,
- price began moving much further per unit of notional.
The April 9 cascade did not begin because volume was highest. It began when liquidity became thin enough for modest flow to move price violently.
Short Answer
In the RAVE-USDT April 2026 data, April 7 and April 8 showed absorption. Sellers were aggressive, open interest kept rising, and price still closed higher. April 9 changed the read: Relative Price Impact rose, buy flow became more concentrated, and price started moving further per unit of notional. Later, open interest dropped during upside moves, which is consistent with short exposure being closed or forced out.
For scanner design, the transition matters more than the single volume spike.
| Data Point | What It Showed |
|---|---|
| Apr 7-8 | Sellers pressed hard, but buyers absorbed the flow and won both daily closes. |
| Apr 8 09:51 | Buy Volume Z-score (5m) reached +28.77, but Sell Volume Z-score (5m) reached +59.63. The largest buy z-score was not buyer control. |
| Apr 9 13:03 | Buy Volume Concentration (5m) reached +8.27 while Net Taker Imbalance (5m) stayed positive. First clean buy-side structure. |
| Apr 9 22:34 | Price moved +15.7% in one minute while Buy Volume Z-score (5m) was only +1.54. Relative Price Impact (5m), not volume size, carried the signal. |
| Apr 10 12:20 | Price rose while open interest fell by 1.46 million contracts, a cleaner short-covering candidate. |
Key Findings
- April 7 and April 8 produced extreme readings, but most were isolated, bidirectional, fragmented, or absorbed.
- The highest Buy Volume Z-score in this three-day sample was not a clean long signal. On April 8 at 09:51, Buy Volume Z-score (5m) was +28.77, but Sell Volume Z-score (5m) was +59.63 and Net Taker Imbalance (5m) was negative.
- A Net Taker Imbalance (5m) near +90 was also not enough. On April 7 at 04:30, both Buy Volume Z-score (5m) and Sell Volume Z-score (5m) were negative, meaning the ratio was extreme because the window was nearly empty.
- April 9 changed the structure. The first useful signal appeared at 13:00-13:03, when Buy Volume Z-score (5m) escalated, Net Taker Imbalance (5m) stayed positive, and Buy Volume Concentration (5m) reached +8.27.
- The largest moves came later, after Relative Price Impact (5m) was already elevated. At 22:34, price moved +15.7% in one minute while Buy Volume Z-score (5m) was only +1.54.
- April 10 confirmed continuation, but not as a single clean short-liquidation story. Some upside windows were consistent with forced short covering, while the largest open interest collapse happened during a price drop.
- Scanner rules should not rank signals by z-score size alone. They need structure: direction, concentration, liquidity, and open interest.
INFO
The open interest values in the evidence tables are reconstructed from the separate metrics CSV used for this post, not from the live scanner stream. That metrics export is sampled every five minutes, so each one minute anomaly row is paired with the latest metrics sample at or before that timestamp. The live scanner can carry one minute open interest readings; this note only explains the CSV join used in this article.
Indicator Reference
Buy Volume Z-score and Sell Volume Z-score measure how abnormal current buy-side or sell-side notional volume is relative to the instrument’s own history.
Net Taker Imbalance measures aggressive directional flow:
(buy notional - sell notional) / total notional x 100
Buy Volume Z-score - Buy Trade Count Z-score
Positive concentration means notional is rising faster than trade count. The flow is coming from larger trades, not only more trades.
Relative Price Impact measures how much price moves per unit of notional volume. High Relative Price Impact means the market is behaving as if available liquidity is thin.
April 7-8: Sellers Pressed, Buyers Absorbed
April 7 and April 8 were not quiet accumulation days. They were a two-day fight.
Sellers were aggressive. They repeatedly hit the market with concentrated sell-side flow, and open interest expanded while those attacks were happening. But the scoreboard favored buyers: April 7 closed 7.7% higher, April 8 closed another 17.8% higher, and the largest sell-side waves produced surprisingly little downside displacement.
Open interest confirms that new risk was being added, not simply churned. On April 7, open interest rose from 11.42 million contracts at 00:05 to 12.06 million by the next midnight, roughly +5.6%. On April 8, it rose from 12.08 million to 13.95 million, roughly +15.5%.
The setup was pressure building, not a clean squeeze trigger. Sellers kept pressing, buyers kept absorbing, and price kept closing higher.
April 7 Opening: Sellers Hit First, Buyers Answer
| Time | Price | Open Interest | Buy Volume Z-score (5m) | Sell Volume Z-score (5m) | Net Taker Imbalance (5m) | Relative Price Impact (5m) |
|---|---|---|---|---|---|---|
| 00:07 | $0.2488 | 11,419,306 | +0.15 | +6.26 | −53.2 | 0.10 |
| 00:08 | $0.2489 | 11,419,306 | +0.24 | +6.46 | −51.1 | 0.12 |
| 00:13 | $0.2503 | 11,429,815 | +6.76 | +2.10 | +42.7 | 0.12 |
| 00:15 | $0.2515 | 11,431,787 | +12.93 | +10.63 | +1.7 | 0.09 |
| 00:16 | $0.2514 | 11,431,787 | +14.11 | +11.35 | −0.2 | 0.08 |
| 00:17 | $0.2511 | 11,431,787 | +3.82 | +8.92 | −30.5 | 0.12 |
Open interest rose from 11,419,306 contracts at 00:05 to 11,496,774 at 00:30, a +77,468 contract increase, or +0.68% during the event. Sellers opened the fight, buyers answered, and then both sides printed elevated volume at the same time. Price still ended the window above where the sell wave began.
April 7 Midday: Both Sides Escalate, Price Rises Anyway
| Time | Price | Open Interest | Buy Volume Z-score (5m) | Sell Volume Z-score (5m) | Net Taker Imbalance (5m) | Relative Price Impact (5m) |
|---|---|---|---|---|---|---|
| 12:06 | $0.2504 | 11,787,320 | +3.69 | +7.73 | −11.8 | 0.09 |
| 12:07 | $0.2507 | 11,787,320 | +4.33 | +8.23 | −8.1 | 0.07 |
| 12:08 | $0.2511 | 11,787,320 | +4.85 | +9.68 | −10.6 | 0.03 |
| 12:09 | $0.2516 | 11,787,320 | +5.77 | +10.10 | −5.3 | 0.01 |
| 12:10 | $0.2516 | 11,837,000 | +1.54 | +1.41 | +10.6 | 0.03 |
Open interest rose from 11,787,320 contracts at 12:05 to 11,837,000 at 12:10, a +49,680 contract increase, or +0.42% during the event. Sell Volume Z-score (5m) dominated through 12:09 while price moved up anyway; by 12:10, both z-scores cooled and Net Taker Imbalance (5m) flipped positive. Low Relative Price Impact (5m) says the market behaved as if it was absorbing the earlier sell-side flow rather than breaking lower.
April 8 Morning: Sellers Escalate, The Book Holds
| Time | Price | Open Interest | Buy Volume Z-score (5m) | Sell Volume Z-score (5m) | Net Taker Imbalance (5m) | Relative Price Impact (5m) |
|---|---|---|---|---|---|---|
| 07:06 | $0.2727 | 12,308,370 | +0.16 | +20.73 | −86.4 | 0.07 |
| 07:07 | $0.2731 | 12,308,370 | +1.44 | +22.32 | −76.6 | 0.04 |
| 07:08 | $0.2732 | 12,308,370 | +1.63 | +22.43 | −75.2 | 0.04 |
| 07:09 | $0.2732 | 12,308,370 | +1.69 | +23.76 | −74.8 | 0.03 |
| 07:10 | $0.2727 | 12,378,886 | +0.60 | +0.34 | −9.7 | 0.33 |
Open interest rose from 12,308,370 contracts at 07:05 to 12,378,886 at 07:10, a +70,516 contract increase, or +0.57% during the event. Sell-side pressure dominated through 07:09, then both volume z-scores cooled sharply at 07:10. Sellers hit the market hard, but price barely moved.
April 8 Mid-Morning: Huge Volume, No Clean Buyer Dominance
| Time | Price | Open Interest | Buy Volume Z-score (5m) | Sell Volume Z-score (5m) | Net Taker Imbalance (5m) | Relative Price Impact (5m) |
|---|---|---|---|---|---|---|
| 09:45 | $0.2762 | 12,286,228 | +1.45 | +0.30 | +47.7 | 0.48 |
| 09:47 | $0.2765 | 12,286,228 | +3.32 | +1.46 | +33.3 | 0.39 |
| 09:48 | $0.2810 | 12,286,228 | +18.58 | +29.15 | −18.4 | 0.15 |
| 09:49 | $0.2814 | 12,286,228 | +20.22 | +39.77 | −22.8 | 0.13 |
| 09:50 | $0.2804 | 12,340,711 | +22.12 | +47.84 | −19.1 | 0.07 |
| 09:51 | $0.2802 | 12,340,711 | +28.77 | +59.63 | −9.8 | 0.05 |
Open interest rose from 12,286,228 contracts at 09:45 to 12,340,711 at 09:50, a +54,483 contract increase, or +0.44% during the event. The window printed the largest Buy Volume Z-score (5m) reading in the three-day sample, but Sell Volume Z-score (5m) was even larger and Net Taker Imbalance (5m) turned negative. Buyers did not control that window. The market absorbed a bidirectional liquidity event.
April 7-8 gave useful context, not an entry trigger. Buyers were winning the daily closes, but the market was still absorbing attacks instead of moving freely through thin liquidity.
The useful question was not:
Is Buy Volume Z-score (5m) large?
The useful question was:
Has absorption turned into displacement?
April 9: Structure Replaces Noise
April 9 was different.
RAVE-USDT opened near $0.3164 and ended near $0.9976, a 215% session gain. The microstructure changed before the largest moves.
The first change was alignment, not a massive price move.
Open interest rose from 13.97 million contracts at 00:05 to 31.36 million by 23:55, roughly +124.5%. The intraday sequence matters: open interest kept building through the afternoon, then dropped sharply during the late cascade. New risk entered first. Forced-exit behavior appeared later.
13:00-13:03: First Coordinated Buy-Side Signal
At 12:58 and 12:59, both volume z-scores were negative. Then buy flow arrived in a different form than the earlier failed spikes.
| Time | Price | Open Interest | Buy Volume Z-score (5m) | Sell Volume Z-score (5m) | Net Taker Imbalance (5m) | Buy Volume Concentration (5m) | Relative Price Impact (5m) |
|---|---|---|---|---|---|---|---|
| 12:58 | $0.3624 | 17,136,603 | −1.32 | −2.18 | +4.9 | −0.40 | 0.74 |
| 12:59 | $0.3644 | 17,136,603 | −1.18 | −2.45 | +24.5 | −0.52 | 2.03 |
| 13:00 | $0.3689 | 17,141,375 | +9.05 | +3.93 | +26.0 | +4.67 | 0.61 |
| 13:01 | $0.3681 | 17,141,375 | +11.47 | +5.04 | +28.5 | +6.38 | 0.43 |
| 13:02 | $0.3703 | 17,141,375 | +14.23 | +6.22 | +30.4 | +6.97 | 0.48 |
| 13:03 | $0.3732 | 17,141,375 | +18.19 | +9.83 | +24.4 | +8.27 | 0.49 |
Buy Volume Z-score (5m) escalated for four consecutive readings. Net Taker Imbalance (5m) stayed positive. Buy Volume Concentration (5m) reached +8.27, the highest buy concentration in the three-day sample.
Price only moved from $0.3689 to $0.3732 across the highlighted window. The breakout came later. The structure changed first.
The market was telling a different story: buy-side notional was rising faster than buy trade count, and the flow persisted.
Open interest rose from 17,136,603 contracts at 12:55 to 17,182,496 at 13:05, a +45,893 contract increase, or +0.27% during the event. The window still showed position-building, not capitulation. New risk entered while the first clean buy-side structure appeared.
15:23-15:38: Thin-Book Breakout
The next signal was not volume. It was price impact.
Before the 15:35 move, both volume z-scores were mostly negative while Relative Price Impact (5m) stayed elevated.
| Time | Price | Open Interest | Buy Volume Z-score (5m) | Sell Volume Z-score (5m) | Net Taker Imbalance (5m) | Relative Price Impact (5m) |
|---|---|---|---|---|---|---|
| 15:23 | $0.3956 | 20,609,398 | −0.92 | −1.20 | +6.0 | 1.72 |
| 15:24 | $0.3945 | 20,609,398 | −1.63 | −1.63 | −11.7 | 1.02 |
| 15:25 | $0.3922 | 20,703,571 | −1.52 | −1.62 | −3.4 | 3.74 |
| 15:28 | $0.3922 | 20,703,571 | −1.51 | −1.77 | +9.9 | 2.11 |
| 15:30 | $0.3956 | 20,728,002 | −1.47 | −1.83 | +17.5 | 2.56 |
| 15:34 | $0.4042 | 20,728,002 | +0.18 | −0.17 | +8.1 | 3.09 |
| 15:35 | $0.4364 | 20,805,339 | +10.29 | +6.49 | +18.0 | 2.20 |
| 15:38 | $0.4498 | 20,805,339 | +19.87 | +14.66 | +12.2 | 1.50 |
At 15:35, price moved from $0.4042 to $0.4364 in one minute.
The one minute move was +7.9%.
By 15:38, price reached $0.4498. From the pre-event level at 15:23, the move was roughly +14%.
Relative Price Impact (5m) rose before the volume spike. The market was already behaving as if liquidity was thin. When buy volume arrived, price could move.
Open interest rose again during this window, from 20,609,398 contracts at 15:20 to 20,803,266 at 15:40, a +193,868 contract increase, or +0.94% during the event. Sellers had not fully given up. The market became easier to move while positioning was still expanding.
22:00-22:37: Cascade, Then Volume Catches Up
For nearly twenty minutes before the first trigger, both volume z-scores were negative while Relative Price Impact (5m) was elevated.
| Time | Price | Open Interest | Buy Volume Z-score (5m) | Sell Volume Z-score (5m) | Net Taker Imbalance (5m) | Relative Price Impact (5m) |
|---|---|---|---|---|---|---|
| 22:00 | $0.6789 | 35,550,109 | −1.53 | −1.20 | −11.2 | 3.15 |
| 22:10 | $0.6891 | 35,902,630 | −1.66 | −1.49 | −0.5 | 3.87 |
| 22:15 | $0.7003 | 36,117,231 | −1.27 | −1.59 | +13.9 | 3.12 |
| 22:18 | $0.7058 | 36,117,231 | −0.98 | −1.20 | +9.8 | 1.92 |
| 22:19 | $0.7619 | 36,117,231 | +9.09 | +4.68 | +23.0 | 2.90 |
| 22:22 | $0.7642 | 35,335,650 | +23.81 | +16.24 | +12.1 | 1.41 |
At 22:19, Buy Volume Z-score (5m) jumped from negative to +9.09 and price moved +7.9% in one minute.
Open interest started to matter differently here. From 22:15 to 22:20, open interest fell from 36,117,231 contracts to 35,335,650 while price jumped, a −781,581 contract decrease, or −2.16% during the event. Some short exposure was likely closed or forced out during the first evening trigger.
But that was not the largest displacement.
After the first trigger, volume cooled again. Then price moved violently before Buy Volume Z-score (5m) became extreme.
| Time | Price | Open Interest | Buy Volume Z-score (5m) | Sell Volume Z-score (5m) | Net Taker Imbalance (5m) | Buy Volume Concentration (5m) | Relative Price Impact (5m) |
|---|---|---|---|---|---|---|---|
| 22:31 | $0.7539 | 35,314,231 | −0.16 | −0.21 | +8.9 | −0.44 | 0.49 |
| 22:32 | $0.7626 | 35,314,231 | −0.09 | −0.20 | +12.7 | −0.36 | 1.59 |
| 22:33 | $0.7624 | 35,314,231 | +0.03 | +0.06 | +6.4 | −0.36 | 2.08 |
| 22:34 | $0.8820 | 35,314,231 | +1.54 | +0.86 | +25.4 | +0.26 | 7.30 |
| 22:35 | $0.8700 | 35,450,377 | +2.99 | +2.54 | +17.3 | +0.39 | 4.32 |
| 22:36 | $0.9506 | 35,450,377 | +8.03 | +7.75 | +13.7 | +2.02 | 2.92 |
| 22:37 | $0.9834 | 35,450,377 | +9.01 | +8.64 | +14.1 | +1.80 | 2.95 |
At 22:34, price moved from $0.7624 to $0.8820 in one minute.
The move was +15.7% while Buy Volume Z-score (5m) was only +1.54.
By 22:37, price reached $0.9834. From 22:33, the move was roughly +29% in four minutes. Buy Volume Z-score (5m) caught up only after the first large displacement had already happened.
The earliest useful clue was not the biggest volume number. It was the market’s ability to move sharply on modest volume.
Relative Price Impact showed that condition first.
Then open interest showed the give-up. From 22:30 to 22:40, open interest collapsed from 35,314,231 contracts to 30,783,829, a drop of 4.53 million contracts, or −12.83% during the event. Price was exploding while open interest was being removed. The earlier sessions did not have that signature. The market was no longer only absorbing new risk. Existing short exposure was likely being forced out.
April 10: Continuation, Not Discovery
April 10 matters, but it is not the early-detection window.
By then, the structure had already changed. Price had already moved from $0.3164 to almost $1.00 on April 9. The job of the scanner on April 10 was no longer to detect the first regime change. It was to track continuation: expanding risk, forced exits, and violent price movement through thin liquidity.
From the first April 10 CSV print to the final print, price moved from $1.0356 to $1.6074. The session high was $1.6900 at 13:51. Open interest started near 30.33 million contracts, peaked at 36.76 million at 10:30, then ended below 30 million.
April 10 was not simply “short liquidation.” The day had three different states:
- new risk entered during the first continuation leg,
- some upside windows were consistent with forced short covering or liquidation,
- the largest open interest collapse happened during a price drop, which points to broader deleveraging rather than short liquidation.
10:15-10:22: Continuation With New Risk Entering
| Time | Price | Open Interest | Buy Volume Z-score (5m) | Sell Volume Z-score (5m) | Net Taker Imbalance (5m) | Relative Price Impact (5m) |
|---|---|---|---|---|---|---|
| 10:15 | $1.1417 | 35,843,614 | +4.80 | +5.09 | +6.3 | 0.74 |
| 10:16 | $1.1677 | 35,843,614 | +11.22 | +12.04 | +6.9 | 0.78 |
| 10:18 | $1.2067 | 35,843,614 | +12.90 | +13.89 | +8.0 | 0.85 |
| 10:19 | $1.2415 | 35,843,614 | +17.51 | +19.22 | +6.6 | 0.95 |
| 10:20 | $1.2849 | 36,484,378 | +14.12 | +14.62 | +7.4 | 1.14 |
| 10:22 | $1.3346 | 36,484,378 | +8.85 | +9.43 | +4.6 | 1.34 |
Price moved from $1.1417 at 10:15 to $1.3346 at 10:22, a +16.9% move in seven minutes.
But open interest rose from 35,843,614 contracts at 10:15 to 36,677,866 at 10:25, a +834,252 contract increase, or +2.33% during the event. Positions were not being forced out yet. New risk was entering during a violent two-sided continuation leg. Sell Volume Z-score (5m) was slightly stronger than Buy Volume Z-score (5m) through the peak, so this was still a battle, not one-way buyer control.
12:19-12:20: First Clean Short-Covering Candidate
| Time | Price | Open Interest | Buy Volume Z-score (5m) | Sell Volume Z-score (5m) | Net Taker Imbalance (5m) | Relative Price Impact (5m) |
|---|---|---|---|---|---|---|
| 12:15 | $1.2589 | 36,635,376 | −0.32 | −0.23 | −1.0 | 1.51 |
| 12:18 | $1.2714 | 36,635,376 | −0.55 | −0.84 | +4.7 | 1.55 |
| 12:19 | $1.3471 | 36,635,376 | +5.32 | +3.82 | +19.7 | 2.50 |
| 12:20 | $1.3372 | 35,172,572 | +6.75 | +5.50 | +17.8 | 1.87 |
| 12:21 | $1.3354 | 35,172,572 | +7.33 | +6.48 | +15.9 | 1.91 |
This is the cleaner short-covering window.
Price jumped from $1.2589 at 12:15 to $1.3372 at 12:20, while open interest dropped from 36,635,376 to 35,172,572 contracts. Open interest fell by 1.46 million contracts, or 3.99%, during a +6.2% price move. Buy Volume Z-score (5m) turned positive, Net Taker Imbalance (5m) stayed strongly positive, and taker flow aligned with the direction of the move.
Without liquidation prints, the exact mechanism cannot be proven. But this window is consistent with shorts being forced to close or liquidated.
13:50-14:20: The Largest Open Interest Collapse Was Not Short Liquidation
| Time | Price | Open Interest | Buy Volume Z-score (5m) | Sell Volume Z-score (5m) | Net Taker Imbalance (5m) | Relative Price Impact (5m) |
|---|---|---|---|---|---|---|
| 13:50 | $1.6777 | 36,517,594 | −0.23 | −0.62 | +11.4 | 2.17 |
| 13:54 | $1.4350 | 36,517,594 | +2.53 | +3.03 | −3.8 | 6.34 |
| 13:55 | $1.4927 | 34,094,178 | +3.57 | +4.02 | −2.7 | 4.44 |
| 14:10 | $1.3348 | 33,178,985 | +1.52 | +1.78 | −2.7 | 6.76 |
| 14:20 | $1.3950 | 31,653,517 | −0.86 | −0.83 | +4.9 | 7.90 |
This is the trap in the data.
From 13:50 to 14:20, open interest collapsed from 36,517,594 to 31,653,517 contracts, a −4.86 million contract drop, or −13.32% during the event. But price also fell from $1.6777 to $1.3950, a −16.9% move.
The data does not support a short-liquidation read. A large open interest drop during a sharp price decline points more toward long exposure closing, long liquidation, or broad deleveraging. The high Relative Price Impact (5m) readings show thin liquidity, but direction still matters.
15:00-15:20: Upside Resumes While Open Interest Contracts
| Time | Price | Open Interest | Buy Volume Z-score (5m) | Sell Volume Z-score (5m) | Net Taker Imbalance (5m) | Relative Price Impact (5m) |
|---|---|---|---|---|---|---|
| 15:00 | $1.2782 | 31,021,690 | −1.04 | −1.02 | +1.5 | 1.69 |
| 15:05 | $1.3508 | 30,256,695 | −0.48 | −0.62 | +8.7 | 9.17 |
| 15:10 | $1.3925 | 30,265,866 | −0.47 | −0.63 | +11.5 | 5.11 |
| 15:16 | $1.4979 | 30,293,576 | +0.90 | +0.18 | +14.1 | 6.03 |
| 15:20 | $1.4708 | 30,043,471 | −1.02 | −0.82 | −3.1 | 2.69 |
This window looks closer to short covering again.
Price rose from $1.2782 at 15:00 to $1.4708 at 15:20, a +15.1% move. Open interest fell from 31,021,690 to 30,043,471 contracts over the same window, a −978,219 contract decrease, or −3.15% during the event. Buy Volume Z-score (5m) was not extreme, but Relative Price Impact (5m) was high and Net Taker Imbalance (5m) stayed positive through the main advance.
The April 9 pattern returned: price moved far on modest volume while open interest contracted.
The April 10 conclusion should be precise: parts of the session were consistent with forced short covering or short liquidation, but the whole day was not a clean liquidation event. It was a continuation day with alternating new risk, forced exits, and broad deleveraging.
Scanner Design Lesson
A one-line rule would have overfired:
Buy Volume Z-score (5m) > 10
It would have triggered on April 7, April 8, April 9, and April 10. Some triggers were useful. Others were noise.
A better rule needs structure:
Relative Price Impact (5m) > threshold AND Net Taker Imbalance (5m) > 15 AND ( Buy Volume Z-score (5m) > 2 OR Buy Volume Concentration (5m) > 1 ) AND NOT ( Sell Volume Z-score (5m) > Buy Volume Z-score (5m) AND Net Taker Imbalance (5m) < 0 )
This is not a final production rule. It is the logic the case study points toward.
Do not ask only whether buy volume is abnormal.
Ask whether the market is easy to move, whether the flow is directionally aligned, and whether the buy-side activity is concentrated rather than fragmented.
Summary
The first available open interest sample after April 7 00:00 was 11,419,306 contracts at 00:05. The highest open interest value across the April 7-10 files was 36,759,111 contracts on April 10 at 10:30. Open interest increased by 25.34 million contracts, or +221.9%, from the first available sample.
Price moved from $0.24781 at the first April 7 anomaly print to $1.22784 at the April 10 open interest peak, a +395.5% move. Any short exposure opened near the start of April 7 and still open into that April 10 peak was under severe mark-to-market pressure.
Relative Price Impact also changed regime. Median Relative Price Impact (5m) was low on April 7 and April 8, then rose sharply:
| Date | Median Relative Price Impact (5m) | 95th Percentile Relative Price Impact (5m) |
|---|---|---|
| Apr 7 | 0.31 | 1.26 |
| Apr 8 | 0.41 | 1.71 |
| Apr 9 | 0.80 | 3.99 |
| Apr 10 | 1.48 | 6.34 |
The liquidity transition is visible in those numbers. April 7 and April 8 showed absorption: heavy flow, low price impact. April 9 and April 10 showed displacement: price moved much further per unit of volume, consistent with a thinner order book.
| Date / Time | Open Interest | Buy Volume Z-score (5m) | Sell Volume Z-score (5m) | Net Taker Imbalance (5m) | Buy Volume Concentration (5m) | Relative Price Impact (5m) | Result |
|---|---|---|---|---|---|---|---|
| Apr 7 04:30 | 11,786,980 | −0.75 | −0.75 | +89.5 | +0.33 | 0.83 | Flat |
| Apr 8 09:51 | 12,340,711 | +28.77 | +59.63 | −9.8 | +9.58 | 0.05 | Not buyer dominance |
| Apr 9 13:03 | 17,141,375 | +18.19 | +9.83 | +24.4 | +8.27 | 0.49 | Structure changed |
| Apr 9 15:35 | 20,805,339 | +10.29 | +6.49 | +18.0 | +1.63 | 2.20 | +7.9% in one minute |
| Apr 9 22:34 | 35,314,231 | +1.54 | +0.86 | +25.4 | +0.26 | 7.30 | +15.7% in one minute |
| Apr 10 12:20 | 35,172,572 | +6.75 | +5.50 | +17.8 | +2.24 | 1.87 | Short-covering candidate |
| Apr 10 13:55 | 34,094,178 | +3.57 | +4.02 | −2.7 | −0.50 | 4.44 | Broad deleveraging |
The largest z-score was not the best signal. The better read combined improving directional flow, concentrated buy-side activity, elevated Relative Price Impact, and open interest behavior.
That mix separated April 9 from April 7-8 and explained the cleaner continuation windows on April 10.
Related Reading
- Price Up, Open Interest Down: You’re Probably Reading It Wrong
- Order Flow Absorption vs. Exhaustion
- Open Interest Scanner: Binance Perpetuals Positioning Data
Frequently Asked Questions
Can a potential short squeeze be detected early with order-flow data?
Yes, but not from Buy Volume Z-score alone. In the RAVE-USDT April 2026 data, the better early read came from the transition between absorption and displacement: sellers stayed aggressive on April 7-8, price kept closing higher, Relative Price Impact (5m) rose on April 9, buy-side flow became more concentrated, and later upside windows appeared while open interest contracted.
Why did the highest Buy Volume Z-score fail?
Because it was not buyer dominance. At April 8 09:51, Buy Volume Z-score (5m) reached +28.77, but Sell Volume Z-score (5m) reached +59.63 and Net Taker Imbalance (5m) was negative. Both sides were active, and sellers dominated the aggressive flow.
Why was the April 7 Net Taker Imbalance (5m) near +90 not bullish?
Because both Buy Volume Z-score (5m) and Sell Volume Z-score (5m) were negative at the same time. Net Taker Imbalance (5m) is a ratio. When total volume is low, a small amount of one-sided flow can create an extreme reading without meaningful participation.
Why did April 9 work better?
April 9 combined multiple conditions. Buy flow became concentrated at 13:00-13:03. Relative Price Impact rose before the 15:35 and 22:34 displacements. Price started moving much further per unit of notional.
What should a scanner learn from this?
Do not treat a single indicator as a signal. Use Buy Volume Z-score (5m) for participation, Net Taker Imbalance (5m) for direction, Buy Volume Concentration (5m) for flow quality, and Relative Price Impact (5m) for liquidity conditions. The useful setup appears when those fields describe the same market state.
The scanner filters described in this post are available as configurable filters in AnomIQ. The Deep Dive panel shows rolling anomaly readings live, per instrument, updated every trade.