Free TradingView Volume Anomaly Indicator: Z-Score Pine Script
The TradingView Volume Anomaly Indicator is a free Pine Script tool that uses rolling volume z-score, trend cleanliness and relative price impact to flag unusual volume, absorption setups and exit warnings on crypto charts.
Most volume indicators answer one question: is volume high right now?
That confirms the candle was busy. It does not tell you timing: early move, middle of the move, or late-stage exhaustion.
A free open-source TradingView script built on rolling Volume Z-Score math does two jobs: it flags buildup before price commits, then warns when the move is late.
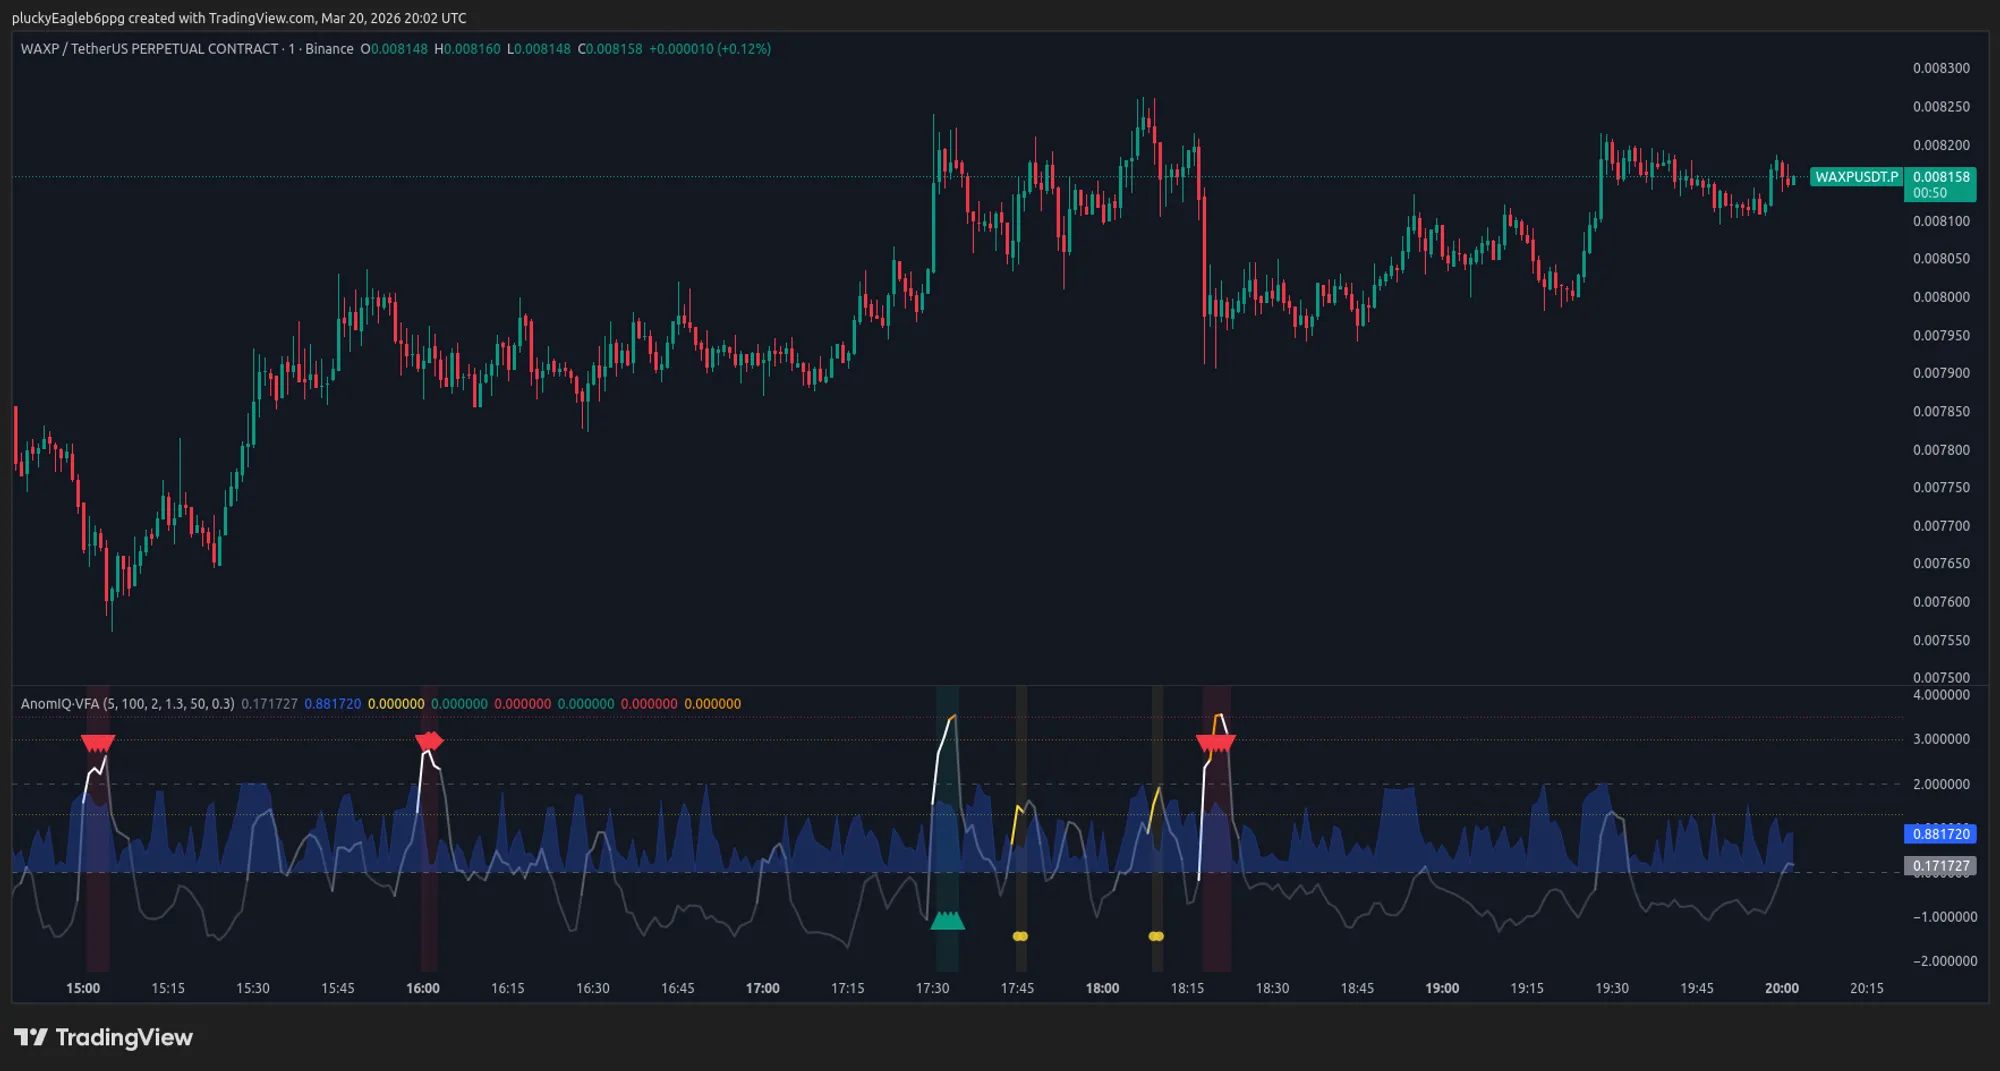
Volume Flow Anomaly · AnomIQ Preview
For the scanner-based workflow behind the same statistical idea, see the z-score volume spike detection guide. It explains how the same rolling baseline works with total, buy-side, and sell-side volume across live scanner timeframes.
If you want the alert-versus-scanner decision, read TradingView Alerts vs Real-Time Market Scanners.
TradingView Volume Anomaly Indicator: Quick Answer
The indicator reduces raw volume into three reads: buildup, absorption, and late-stage extension. The useful question is not just whether volume is high. It is whether that volume moved price efficiently.
| Signal | Marker | What it means | Trading use |
|---|---|---|---|
| Setup | Yellow dot | Volume Z-Score is rising before price commits | Watchlist candidate |
| Absorption | Diamond | High volume with limited price movement | Possible pre-move or reversal area |
| Exit warning | Triangle | High volume and clean directional movement after extension | Avoid late entries, manage exit |
The free TradingView version estimates buy and sell pressure from candle structure. The full AnomIQ scanner uses tick-level taker classification, rolling z-score volume spike detection, and real-time order-flow fields, which is more precise for separating absorption from order flow exhaustion.
The Problem With Standard Volume Indicators
A standard volume bar shows how much was traded in the current candle. “High volume” means different things depending on the asset, the time of day, and the current volatility regime.
A 1-minute candle with $2M traded on BTCUSDT at 3am UTC is exceptional. The same $2M at 9am UTC during a news event is unremarkable. A fixed threshold cannot distinguish the two.
Timing is the second problem. By the time a volume spike is obvious on a bar chart, price has already moved. You are confirming what happened, not acting on what is about to.
What the Script Measures
The script computes three values from price and volume data on each bar:
1. Volume Z-Score
The script measures how many standard deviations the current rolling window of volume sits above its historical mean.
Volume Z-Score = (Mean Volume Window - Historical Mean) / Historical StdDevMean Volume Window is the average volume across the rolling window, not a single bar’s value. The z-score measures how far that window average sits from the historical baseline.
A reading of 0 means window volume is exactly average. A reading of 2.0 means it is two standard deviations above the historical norm, statistically unusual for this asset at this time. The z-score is comparable across assets and times of day because it adapts to the local baseline.
The rolling window covers the last 5 completed bars plus the bar in progress. On a 1-minute chart that is approximately 5 minutes of activity.
2. Trend Cleanliness
High volume alone doesn’t confirm a directional move. Volume spikes during two-sided consolidation near key levels too. Trend cleanliness measures how consistently price action moved in one direction across the rolling window:
cleanliness = |net_price_move| / sum(|individual_bar_moves|)A value of 100% means every bar moved the same way, a perfect one-directional trend. A value near zero means bars alternated regardless of total distance travelled.
The metric separates directional moves from high-volume noise.
3. Relative Price Impact
Relative Price Impact measures how much price moved per dollar of volume transacted:
Relative Price Impact = |Price Return %| / (Window Notional Volume / $1M)Window Notional Volume is USD-denominated volume over the window (price × quantity). When a large amount of notional volume moves price very little, a passive order on the other side is absorbing the flow. That absorption is the earliest sign a directional move is loading.
The Three-Phase Signal Sequence
Most volume indicators stop at the spike. This script separates three states: setup, entry, and exit warning.
Phase 1 Setup: Volume Builds Before Direction
Signal: Yellow dot
Vol Z crosses the early warning threshold (default 1.3σ) while trend cleanliness is still low. Volume is arriving but price has not committed to a direction yet.
Quant rationale: When vol Z rises without a corresponding rise in trend cleanliness, volume is flowing in but price hasn’t picked a direction. A large participant is building a position (accumulating or distributing) before committing to a move. The gap between rising volume and flat price is the earliest detectable sign of what’s coming.
On fast-moving symbols the yellow dot often appears before the absorption diamond, though the timing depends on how quickly volume builds. Watch. Don’t enter yet.
Phase 2 Entry: Absorption Detected
Signal: Absorption diamond
Vol Z is above the main threshold (default 2.0σ) and price barely moved over the window (less than 0.3% return, low relative price impact).
Teal diamond: the estimated buy side dominated the window, bullish lean. Red diamond: the estimated sell side dominated, bearish lean.
Quant rationale: When volume is anomalously elevated but price barely moves, a passive counterparty is absorbing the aggressive flow. A large resting limit order is working at this price, acting as a temporary anchor.
When that order finishes filling, the anchor lifts. Price breaks through if the counterparty stops absorbing, or reverses toward them if they reveal directional intent.
The directional move usually follows within 2–5 bars.
Phase 3 Exit Warning: Late Extension
Signal: Teal or red triangle
Vol Z is above the main threshold AND trend cleanliness is above the clean threshold AND price has moved meaningfully in one direction.
Quant rationale: Vol Z is mean-reverting by construction. Once a spike enters the historical lookback it raises the baseline mean, making the same volume level less anomalous with each passing bar. A spike to 2–3σ is typically a one-time event: a large order arriving, a news catalyst, a stop cascade. When that order flow finishes deploying, volume returns to baseline.
The triangle fires at or near the peak of that event. With the spike now normalising, the move needs fresh participation to continue.
Tighten your stop. Plan your exit. Don’t enter here.
How to Use It
Settings:
- Chart: 1-minute timeframe
- Window Length: 5 bars (default), approximately 5 minutes of activity on a 1m chart
- Historical Lookback: 100 bars (default), the baseline for Z-Score calculation
- Vol Z Threshold: 2.0σ (default), adjust higher on volatile assets to reduce noise
- Trend Cleanliness Min: 50% (default), how directional the move must be for a triangle to fire
The sequence to watch for:
Yellow dot → absorption diamond → triangle
Setup      → entry             → exit warning
Two of those three in sequence is worth attention. All three with consistent vol Z elevation across bars is the strongest setup.
What it does not do:
The buy/sell split (which determines whether the diamond is teal or red) uses bar-range geometry to estimate taker side:
buy_fraction = (close - low) / (high - low)Bar-range geometry is only an approximation. It works well on trending bars and poorly on doji or reversal bars. It cannot distinguish a large buyer absorbing sell-side flow from a large seller distributing into buy-side flow. Both can produce similar bar shapes with opposite intent.
Real taker classification requires tick-level data: the actual direction of each individual trade matched against the prevailing bid or ask at execution time. AnomIQ’s scanner processes this in real time, which is why the platform’s absorption signals are more reliable than this approximation.
Why Vol Z Is More Useful Than Relative Volume
Relative volume (RVOL) compares today’s volume to the same time of day over past sessions. It tells you whether today is busier than usual at this hour.
Vol Z asks something narrower: is this specific 5-minute window statistically unusual compared to recent activity on this asset?
For short-term trading that distinction matters. RVOL uses daily or hourly aggregates and doesn’t react to intraday regime shifts. Vol Z reacts within minutes. When a large participant enters the market, vol Z catches it at the window level, not the daily level.
Vol Z also adjusts for the current volatility regime. During high-activity periods the historical stddev grows, so a 2σ reading requires more absolute volume to trigger. During quiet periods less volume crosses that threshold. RVOL doesn’t adapt this way.
Frequently Asked Questions
What is the TradingView Volume Anomaly Indicator?
The TradingView Volume Anomaly Indicator is a free Pine Script tool that uses rolling volume z-score, trend cleanliness and relative price impact to flag unusual volume, absorption setups and exit warnings.
Is the TradingView volume anomaly script free?
Yes. The AnomIQ preview script is free and open-source on TradingView, with the Pine Script visible in the editor.
What does Volume Z-Score measure in TradingView?
Volume Z-Score measures how far the current rolling volume window sits above or below its historical baseline, expressed in standard deviations. It is more adaptive than fixed volume thresholds because each asset is compared with its own recent history.
What do the yellow dot, diamond and triangle mean?
The yellow dot marks early volume buildup, the diamond marks absorption, and the triangle marks a possible exit warning after a directional volume event has extended.
Why is AnomIQ more precise than the TradingView indicator?
The TradingView script estimates buy and sell pressure from candle geometry. AnomIQ processes tick-level trades and classifies taker flow directly, which makes absorption and imbalance reads more precise. For the broader order-flow framework, see Crypto Order Flow Trading and Net Taker Imbalance.
Get the Script
The script is free and open-source. Every line is visible in the Pine Editor.
Volume Flow Anomaly · AnomIQ Preview on TradingView
In AnomIQ itself, the same idea runs on tick-level taker classification across 500+ symbols and three scanner timeframes: 5m, 15m, and 60m. See AnomIQ.