Volume Z-Score Trading: Detect Unusual Volume Spikes
Volume z-score trading asks one practical question: is the current volume spike unusual for this exact market, or is it normal activity dressed up as a large candle?
The volume z-score formula is simple:
Volume Z-Score = (Current Volume - Historical Mean Volume) / Historical StdDev VolumeIn trading, that reading tells you whether the current 5m, 15m, or 60m volume is unusual for that market, not whether the raw dollar amount looks large.
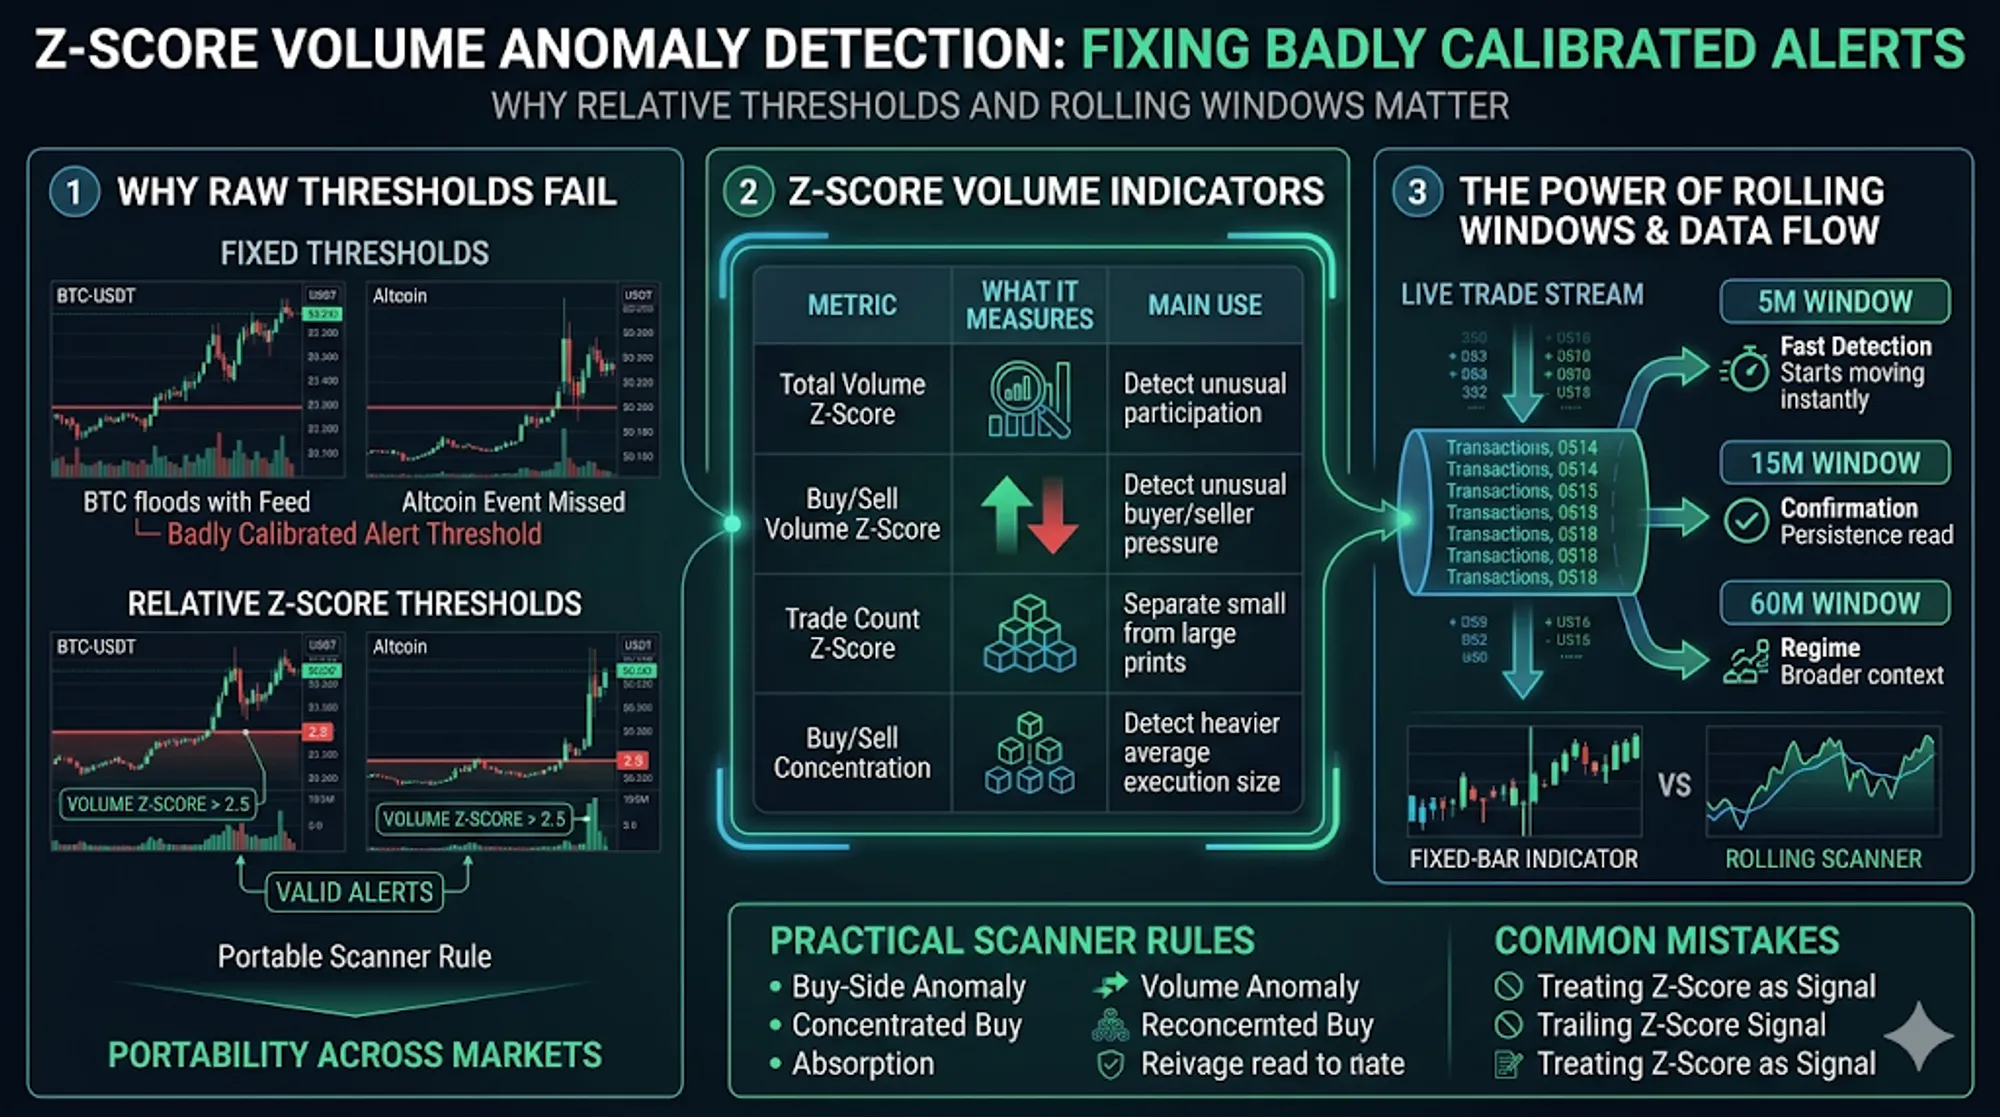
That distinction matters. A five-minute volume spike that is routine for BTC can be a real participation shift on a mid-cap perpetual. A fixed volume threshold cannot handle both markets cleanly: set it high enough for BTC and smaller markets disappear; set it low enough for smaller markets and BTC floods the feed.
That is why AnomIQ uses rolling Total Volume Z-Score, Buy Volume Z-Score, and Sell Volume Z-Score instead of fixed volume cutoffs. Every trade that hits the live stream contributes to the active rolling window. The 5m, 15m, and 60m readings are not waiting for a chart candle to close before they start moving. If buy-side volume starts accelerating two minutes into the window, the scanner should already know.
Use this page for the volume-specific workflow: how to detect crypto volume spikes with rolling z-scores across total volume, buy volume, sell volume, trade count, and concentration. For the broader statistical formula and threshold logic, seeZ-Score in Trading.
Volume Z-Score Trading: Quick Answer
Total Volume Z-Score measures how far current traded notional sits above or below its historical baseline, expressed in standard deviations.
Total Volume Z-Score = (Current Volume - Historical Mean Volume) / Historical StdDev VolumeA Total Volume Z-Score reading of 0 means current volume is normal. A reading of 2.0 means the active window is two standard deviations above baseline. A reading of 3.0 means the market is printing a rare volume event.
The baseline belongs to the instrument. BTC is compared with BTC history. ETH is compared with ETH history. A smaller perpetual is compared with its own history.
That is what makes one scanner rule portable.
| Metric | What it measures | Main use |
|---|---|---|
| Total Volume Z-Score | Total traded notional vs baseline | Detect unusual participation |
| Buy Volume Z-Score | Aggressive buy-side notional vs baseline | Detect unusual buyer pressure |
| Sell Volume Z-Score | Aggressive sell-side notional vs baseline | Detect unusual seller pressure |
| Total Trade Count Z-Score | Execution count vs baseline | Separate many small prints from larger executions |
| Buy Volume Concentration | Buy Volume Z-Score minus Buy Trade Count Z-Score | Detect heavier average buy execution size |
| Sell Volume Concentration | Sell Volume Z-Score minus Sell Trade Count Z-Score | Detect heavier average sell execution size |
Total Volume Z-Score is not a long signal or a short signal. It is the first filter: something unusual is happening here, inspect this market now.
Why Raw Volume Thresholds Fail
Raw volume answers one question: how much traded?
It does not tell you whether that amount is normal. The same notional volume can mean completely different things depending on liquidity, time of day, volatility regime, and the asset’s usual activity profile.
A fixed threshold has three failure modes:
- Too high for smaller markets. It misses the events that matter on thinner pairs.
- Too low for liquid markets. It floods the scanner with normal BTC or ETH activity.
- Stale after regime shifts. It needs manual recalibration when market activity expands or contracts.
This is why fixed thresholds fail crypto scanners. A relative threshold asks the only question that travels across markets: is this reading rare for this instrument?
Total Volume Z-Score gives those markets a shared scale:
| Market | Current 5m volume | Normal 5m volume | Reading |
|---|---|---|---|
| BTC-USDT | $18M | $16M | Not unusual |
| Mid-cap perpetual | $1.8M | $350K | Statistically unusual |
| Thin altcoin | $180K | $25K | Statistically unusual, but needs a liquidity floor |
The raw values do not belong in the same rule. The z-scores do.
Why Real-Time Rolling Windows Matter
Chart indicators usually think in candles. If the indicator runs on a 5-minute chart, the finished read appears after the 5-minute candle closes.
That is late.
The interesting part of a volume event is often the middle of the candle: buy-side notional starts rising, sell-side response fades, Relative Price Impact changes, and the market has not yet printed the obvious screenshot.
AnomIQ uses rolling windows instead:
5mdetects the event as it starts.15mconfirms whether the event is persisting.60mshows whether the event is part of a broader regime.
Every incoming trade is counted into the live aggregate that feeds those windows. The active window is not invisible until a fixed chart candle closes. If aggressive buy volume starts expanding 90 seconds into a 5-minute period, the scanner can already reflect it.
That is the practical difference between a chart overlay and a real-time scanner.
| Fixed-bar indicator | Rolling scanner |
|---|---|
| Waits for selected chart bars | Updates the active window as trades arrive |
| Watches one chart at a time | Watches every tracked pair continuously |
| Usually sees total volume only | Separates total, buy-side, and sell-side volume |
| Good for visual review | Better for alerting and market-wide discovery |
Use the TradingView Volume Anomaly Indicator if you want a free chart version. Use the scanner when the job is market-wide detection.
Total Volume Z-Score vs Buy Volume Z-Score and Sell Volume Z-Score
Total Volume Z-Score tells you participation is unusual. It does not tell you who is pressing.
That is where the side split earns its place.
A large follow-up study tested this distinction directly: across 16,726 extreme-volume events, direction stayed close to a coin flip, while volatility, price impact, volume profile distance, and BTC linkage carried more information about move size.
Total Volume Z-Score
Total Volume Z-Score is the broad detector. It measures total traded notional against baseline.
Total Volume Z-Score (5m) > 3.0That rule catches the market where participation changed. It does not tell you whether buyers caused it, whether sellers caused it, or whether the volume moved price efficiently.
Treat it as a routing rule. It puts the symbol on your screen.
Buy Volume Z-Score
Buy Volume Z-Score measures aggressive buy-side notional against its own baseline.
Buy Volume Z-Score (5m) > 2.5Now the read is directional: taker buy volume is unusually high for this market and timeframe.
Still not enough by itself. Buy-side volume with no price movement can be absorption. Buy-side volume with clean price movement can be momentum. Buy-side volume after a long extension can be the late buyer finally arriving.
Sell Volume Z-Score
Sell Volume Z-Score measures aggressive sell-side notional against its own baseline.
Sell Volume Z-Score (5m) > 2.5Same logic on the other side: sellers are crossing the spread with unusual notional.
The comparison matters more than the isolated value:
| Pattern | Read |
|---|---|
| Buy Volume Z-Score high, Sell Volume Z-Score low | One-sided buyer pressure |
| Sell Volume Z-Score high, Buy Volume Z-Score low | One-sided seller pressure |
| Both high, Net Taker Imbalance near zero | Two-sided battle or absorption |
| Both low, price moving sharply | Thin-book move or liquidity vacuum |
Pair the split with Net Taker Imbalance. Total Volume Z-Score tells you rarity. Net Taker Imbalance tells you balance.
Volume Concentration: When Volume Rises Faster Than Trade Count
Volume becomes more useful when you compare it with trade count.
Two markets can print the same Total Volume Z-Score for opposite reasons:
- many small executions
- fewer, larger executions
AnomIQ exposes that difference with concentration metrics:
Buy Volume Concentration = Buy Volume Z-Score - Buy Trade Count Z-Score
Sell Volume Concentration = Sell Volume Z-Score - Sell Trade Count Z-Score
Intensity Z-Score = Total Volume Z-Score - Total Trade Count Z-Score
This is one of the more useful reads in the scanner.
If Buy Volume Z-Score and Buy Trade Count Z-Score rise together, buy-side activity is broad. More prints, not necessarily heavier prints.
If Buy Volume Z-Score rises faster than Buy Trade Count Z-Score, buy-side volume is becoming concentrated. Buy-side notional is rising faster than buy-side trade count, which implies heavier average buy execution size.
Same idea on the sell side.
| Read | Example | Interpretation |
|---|---|---|
| Fragmented activity | Buy Volume Z-Score = 2.4, Buy Trade Count Z-Score = 2.7 | More prints, not necessarily heavier prints |
| Concentrated buying | Buy Volume Z-Score = 3.2, Buy Trade Count Z-Score = 1.1 | Fewer or normal-count prints carrying larger notional |
| Concentrated selling | Sell Volume Z-Score = 3.4, Sell Trade Count Z-Score = 1.0 | Sell-side notional rising faster than sell-side execution count |
This does not identify the participant. It does show that execution size changed relative to the market’s own baseline. That is a better clue than raw volume alone.
Practical Scanner Rules
Good filters combine three things:
- rarity
- direction
- execution quality
Start simple. Add confirmation only when it removes noise.
1. Basic Volume Anomaly
Today Volume in $ > 500000
AND Total Volume Z-Score (5m) > 2.5
Use this as a discovery filter. It finds liquid symbols where the active 5-minute window is no longer normal.
2. Buy-Side Volume Anomaly
Today Volume in $ > 500000
AND Buy Volume Z-Score (5m) > 2.5
AND Net Taker Imbalance (5m) > 20
This removes balanced noise. You are asking for unusual buy-side notional plus positive taker flow.
3. Sell-Side Volume Anomaly
Today Volume in $ > 500000
AND Sell Volume Z-Score (5m) > 2.5
AND Net Taker Imbalance (5m) < -20
Same structure, reversed. Unusual sell-side notional plus negative taker flow.
4. Concentrated Buy-Side Execution
Today Volume in $ > 500000
AND Buy Volume Z-Score (5m) > 2.5
AND Buy Volume Concentration (5m) > 1.5
AND Net Taker Imbalance (5m) > 20
This is the heavier-execution version of the buy-side filter.
5. Absorption Candidate
Today Volume in $ > 500000
AND Total Volume Z-Score (5m) > 3.0
AND Net Taker Imbalance (5m) > -10
AND Net Taker Imbalance (5m) < 10
AND Relative Price Impact (5m) < 0.2
This looks for unusual volume, balanced aggressive flow, and limited price response. That is where absorption starts to become a reasonable hypothesis instead of a story you tell after the chart reverses.
For examples, see Absorption vs Exhaustion in Order Flow.
How to Read a Volume Z-Score Event
When a scanner alert fires, the z-score is not the conclusion. It is the reason to look.
Ask five questions:
- Is the market liquid enough? A high z-score on weak notional can be noise.
- Which side is unusual? Compare Buy Volume Z-Score and Sell Volume Z-Score.
- Is the volume concentrated? Compare Buy Volume Z-Score with Buy Trade Count Z-Score, or Sell Volume Z-Score with Sell Trade Count Z-Score.
- Did price respond efficiently? Check Relative Price Impact.
- Is the event persisting? Compare 5m with 15m and 60m.
The useful events usually have more than one layer.
Buy Volume Z-Score (5m) = 3.4
Buy Trade Count Z-Score (5m) = 1.2
Buy Volume Concentration (5m) = 2.2
Net Taker Imbalance (5m) = 31
Buy Volume Z-Score (15m) = 1.8
Compare that with:
Buy Volume Z-Score (5m) = 3.4
Buy Trade Count Z-Score (5m) = 3.6
Buy Volume Concentration (5m) = -0.2
Net Taker Imbalance (5m) = 4
Buy Volume Z-Score (15m) = 0.3
Both start with high Buy Volume Z-Score. Only the first has direction, heavier average buy execution, and some 15-minute support.
Where This Fits in AnomIQ
AnomIQ is not a single-chart indicator. It is a real-time scanner for market-wide anomaly detection.
The engine processes live trade flow, updates rolling windows, and exposes user-facing scanner metrics across:
- total volume
- buy volume
- sell volume
- total trade count
- buy trade count
- sell trade count
- total size
- buy size
- sell size
- derived concentration and intensity fields
The production implementation is covered in How to Detect Crypto Volume Anomalies in Real Time. The product point is simpler: define the condition once, then let AnomIQ watch every tracked pair continuously.
You stop asking, “which chart should I check?”
You ask, “which markets are statistically abnormal right now?”
Common Mistakes
Mistake 1: Treating any high z-score as a long or short signal
A high Total Volume Z-Score only says the market is abnormal. Direction comes from buy/sell split, Net Taker Imbalance, Relative Price Impact, and context.
Mistake 2: Ignoring liquidity floors
Low-liquidity markets can print extreme z-scores from small absolute notional. Add a Today Volume in $ filter before trusting the anomaly score.
Mistake 3: Using only one timeframe
The 5m window is fast, but noisy. The 15m and 60m windows tell you whether the event has persistence.
Mistake 4: Confusing more trades with heavier execution
Trade count can rise while average execution size stays small. Concentration metrics help separate fragmented activity from heavier notional execution.
Mistake 5: Waiting for the chart to look obvious
By the time a volume spike is obvious on a closed candle, part of the move may already be gone. Rolling scanner logic is useful because it catches the condition while it is forming.
FAQ
What is z-score volume anomaly detection in trading?
Z-score volume anomaly detection compares current traded volume with a market’s own historical baseline, then expresses the deviation in standard deviations. A high reading means the current volume is statistically unusual for that asset and timeframe.
What is a good Total Volume Z-Score threshold?
As a starting point, Total Volume Z-Score above 2.0 is elevated, above 2.5 is meaningfully unusual, and above 3.0 is rare. In practice, pair the threshold with a liquidity floor and directional confirmation.
Why not just use relative volume?
Relative volume usually compares current volume with an average. Z-score also accounts for normal variability by dividing the deviation by standard deviation. That makes it better at distinguishing a genuinely rare event from normal noisy variation.
Does AnomIQ wait for bars to close?
No. AnomIQ updates rolling windows in real time as trades arrive. Current market activity feeds the live 5m, 15m, and 60m readings before a fixed chart candle has closed.
What is Buy Volume Concentration?
Buy Volume Concentration is Buy Volume Z-Score minus Buy Trade Count Z-Score. A high reading means buy-side notional is rising faster than buy-side trade count, implying heavier average buy execution size.
Raw volume is too blunt for market-wide scanning. Total Volume Z-Score gives you the first pass: this market is no longer behaving like itself.
Then the real read starts. Use Buy Volume Z-Score and Sell Volume Z-Score to find the active side. Use concentration to see whether notional is rising faster than trade count. Use 15m and 60m windows to separate a single burst from a persistent regime.
Open AnomIQ and build a scanner with Total Volume Z-Score, Buy Volume Z-Score, and Sell Volume Z-Score filters across 5m, 15m, and 60m windows.