TradingView Alerts vs Real-Time Market Scanners
TradingView Alerts vs Real-Time Market Scanners: What Active Traders Actually Need
TradingView alerts are fine when you already know what to watch.
They get awkward when you do not.
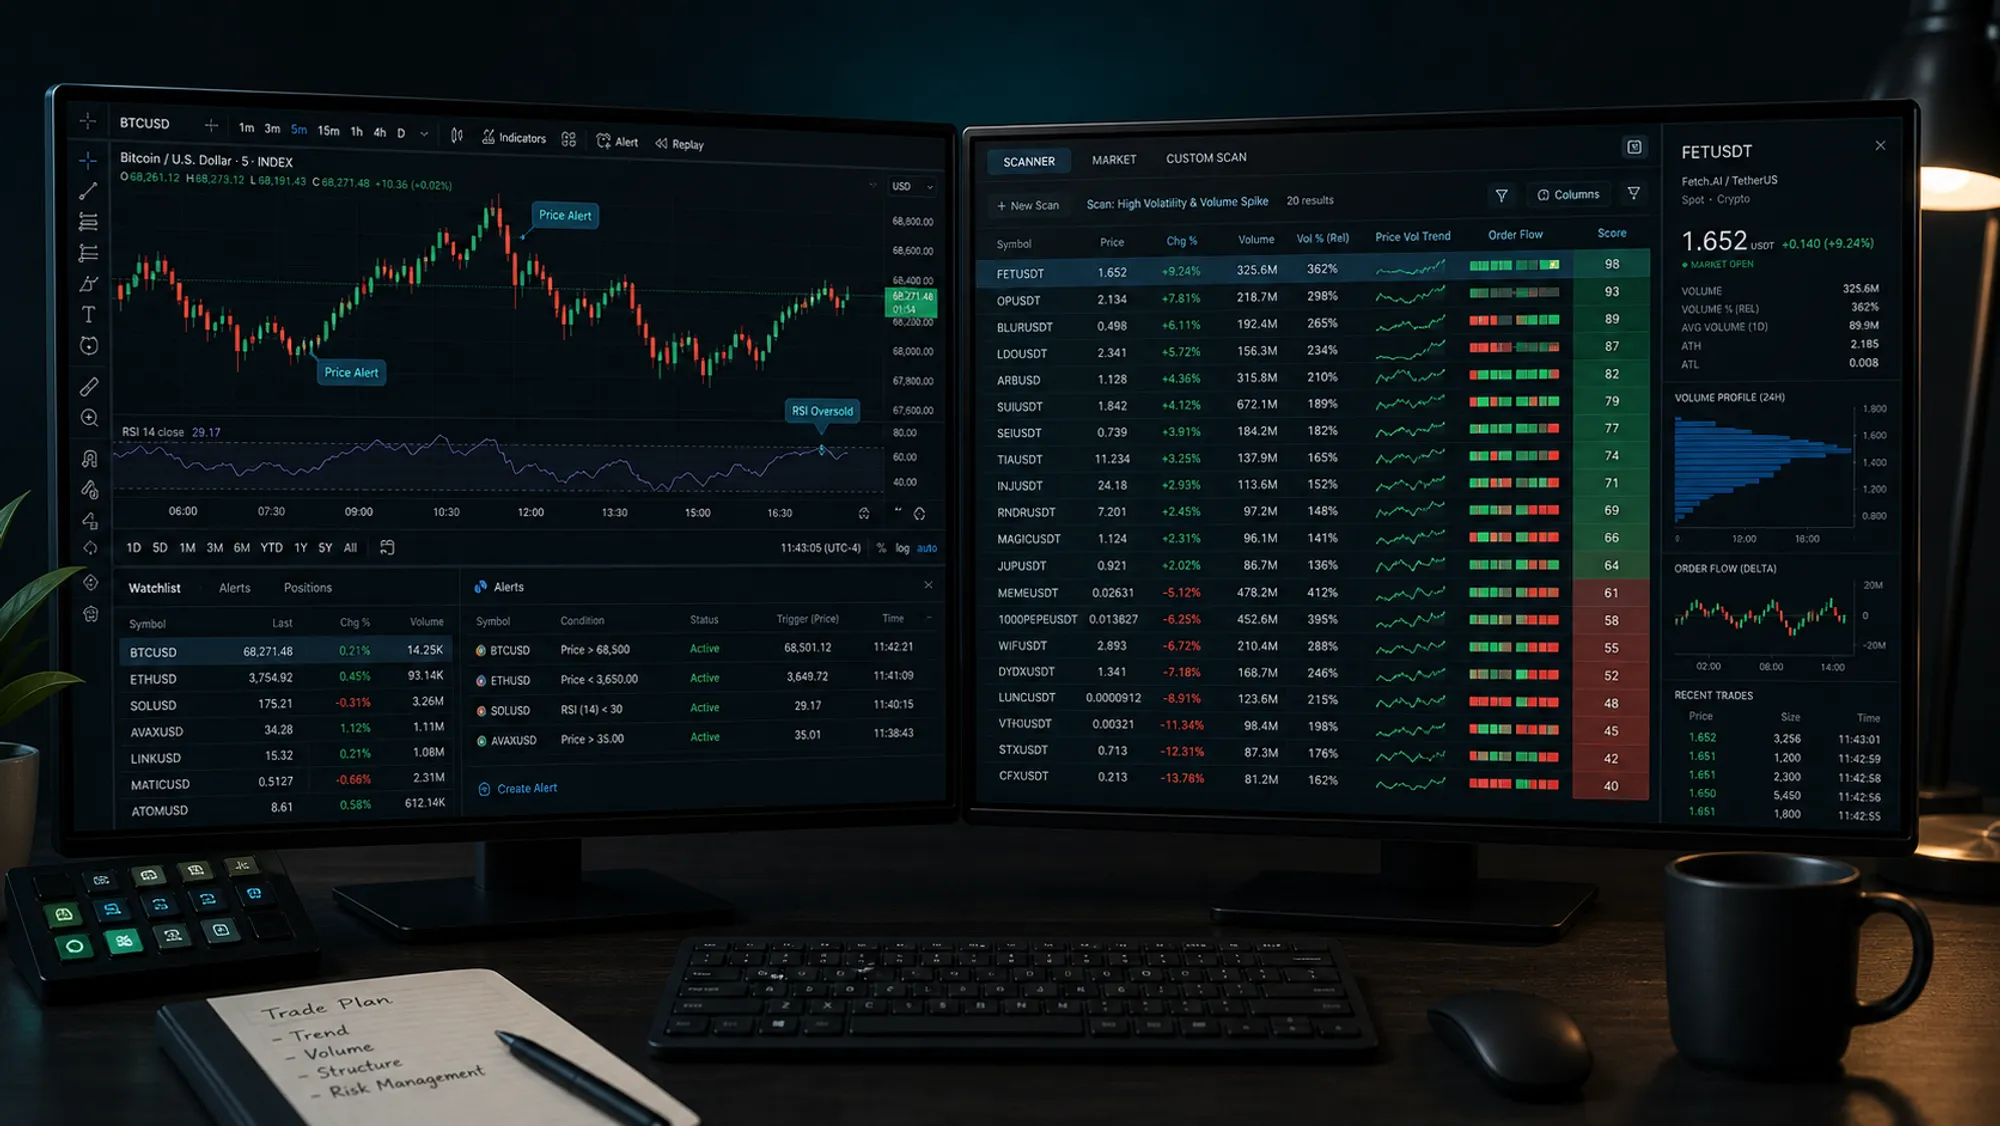
Alerts stay on one chart. A scanner watches the market first and hands you the shortlist. If you track BTC, ETH, and a few alts, alerts are manageable. If you track 40 pairs, upkeep becomes the job.
An alert says, “this chart hit the rule you wrote.” A scanner says, “these markets are worth your attention right now.”
That difference matters.
For the chart-side version of the same anomaly logic, see theTradingView Volume Anomaly Indicator. For the scanner-side version, read Z-Score Volume Anomaly Detection in Crypto Trading.
What Each Tool Is Doing
| Workflow | TradingView alerts | Real-time market scanner |
|---|---|---|
| Primary job | Watch a chart rule | Watch many symbols and surface the matches |
| Best for | One setup, one chart, discretionary review | Cross-market discovery and rule-based screening |
| Data shape | Chart-first | Market-first |
| Maintenance | You manage the symbols and rules | The scanner manages the search space |
| Strength | Visual context | Coverage |
| Weakness | You still have to look at the chart | Less useful if you only care about one chart |
TradingView is a review tool. A scanner is a discovery tool.
If you already know the coin and the pattern, TradingView is enough. If you start with “what in the market is unusual right now,” you need the scanner.
Where TradingView Alerts Work Well
Use TradingView when the question is narrow.
You already know the symbol. You already know the setup. You want a trigger when price crosses a line, volume expands, or a custom script flips state. That is what chart alerts are for.
They also work well when your workflow is visual. Some traders want to see the levels, the candles, and the context before they act. They do not want a queue. They want one chart and one decision.
The problem starts when the same alert logic gets stretched across too many symbols. You end up spending time maintaining watchlists, adjusting thresholds, and checking whether the alert meant anything or just fired in a noisy market.
At that point, the alert is overhead.
Where Alerts Break Down
Three problems show up fast.
First, the alert only knows the chart you attached it to. If BTC is boring but five altcoins are moving, the alert will not help unless you already built and maintained those chart rules.
Second, the alert usually reflects one symbol at a time. That is fine for discretionary trading. It is not fine when your actual job is to find the one symbol worth opening next.
Third, alerts are often blind to relative context. Raw volume can look high on one coin and ordinary on another. Without normalization, you end up treating different markets as if they share the same baseline. They do not.
That is why a fixed rule that works on BTC can miss everything on a small-cap alt.
If you want the background on that problem, read Relative vs Absolute Signals: Why Fixed Thresholds Fail Crypto Scanners. It is the same issue in a different form.
What a Real-Time Scanner Adds
A real-time scanner changes the unit of work.
Instead of checking charts, you define conditions and let the market feed you the candidates. AnomIQ does that with rolling windows and normalized metrics. It looks for unusual volume, directional taker flow, price impact, open interest, and location around previous-session structure.
That matters because the scanner is not asking whether a single chart looks busy. It is asking whether the current move is unusual for that symbol, at that moment, against its own baseline.
That is the question the scanner answers.
It also scales better. One rule can run across many markets. You do not need to babysit thirty charts to know whether something changed.
Example: if you are watching BTC, ETH, SOL, and another 30 liquid pairs, alerts turn into maintenance. You spend time updating symbols, tuning thresholds, and clearing false positives. A scanner lets you ask one question across the whole list: which market is abnormal right now?
For the full order-flow framework behind that workflow, see Crypto Order Flow Trading: Taker Flow and Scanner Rules. For the location layer, see Previous-Day Volume Profile Scanner for Crypto Markets.
The Practical Workflow
The workflow is scanner first, chart second.
- Let the scanner find the symbol.
- Open the chart.
- Check the setup visually.
- Decide whether the move still deserves attention.
That keeps you from babysitting charts.
In that setup, TradingView becomes the review layer. AnomIQ becomes the discovery layer. The scanner cuts the search space. TradingView helps you inspect the one market that earned a look.
It matters because the TradingView Volume Anomaly Indicator gives you the chart-side view of the same idea, so you can compare what the scanner found with what the chart is showing.
If you want to build your own rule set instead of relying on a single alert, start with How to Build a Custom Crypto Scanner. That post covers the rule-building side in more detail.
Which One Should You Use?
Use TradingView alerts if:
- you track a small number of symbols
- you want chart-based confirmation first
- your setup lives on a single chart
Use a real-time scanner if:
- you need to monitor many pairs
- you care about baseline-relative signals
- you want the market to surface the candidates for you
If you are still checking every chart by hand, the scanner is the better first tool. If you already know the symbol and just want a nudge, the alert is enough.
Final Read
TradingView alerts are a good review tool. Real-time scanners are a better discovery tool.
The tradeoff is where the time goes: watchlist upkeep, or actual review.
If your edge comes from seeing the chart early and reacting to one setup, alerts are enough. If your edge comes from finding unusual activity across a market list before everyone else does, the scanner is the right place to start.
Open the scanner, use it to find the market, then use TradingView to inspect the chart. That split saves time.
For the chart-side preview, use the TradingView Volume Anomaly Indicator. For the scanner-side workflow, start with Z-Score Volume Anomaly Detection in Crypto Trading.