Absorption vs Exhaustion in Order Flow: 3 Crypto Examples
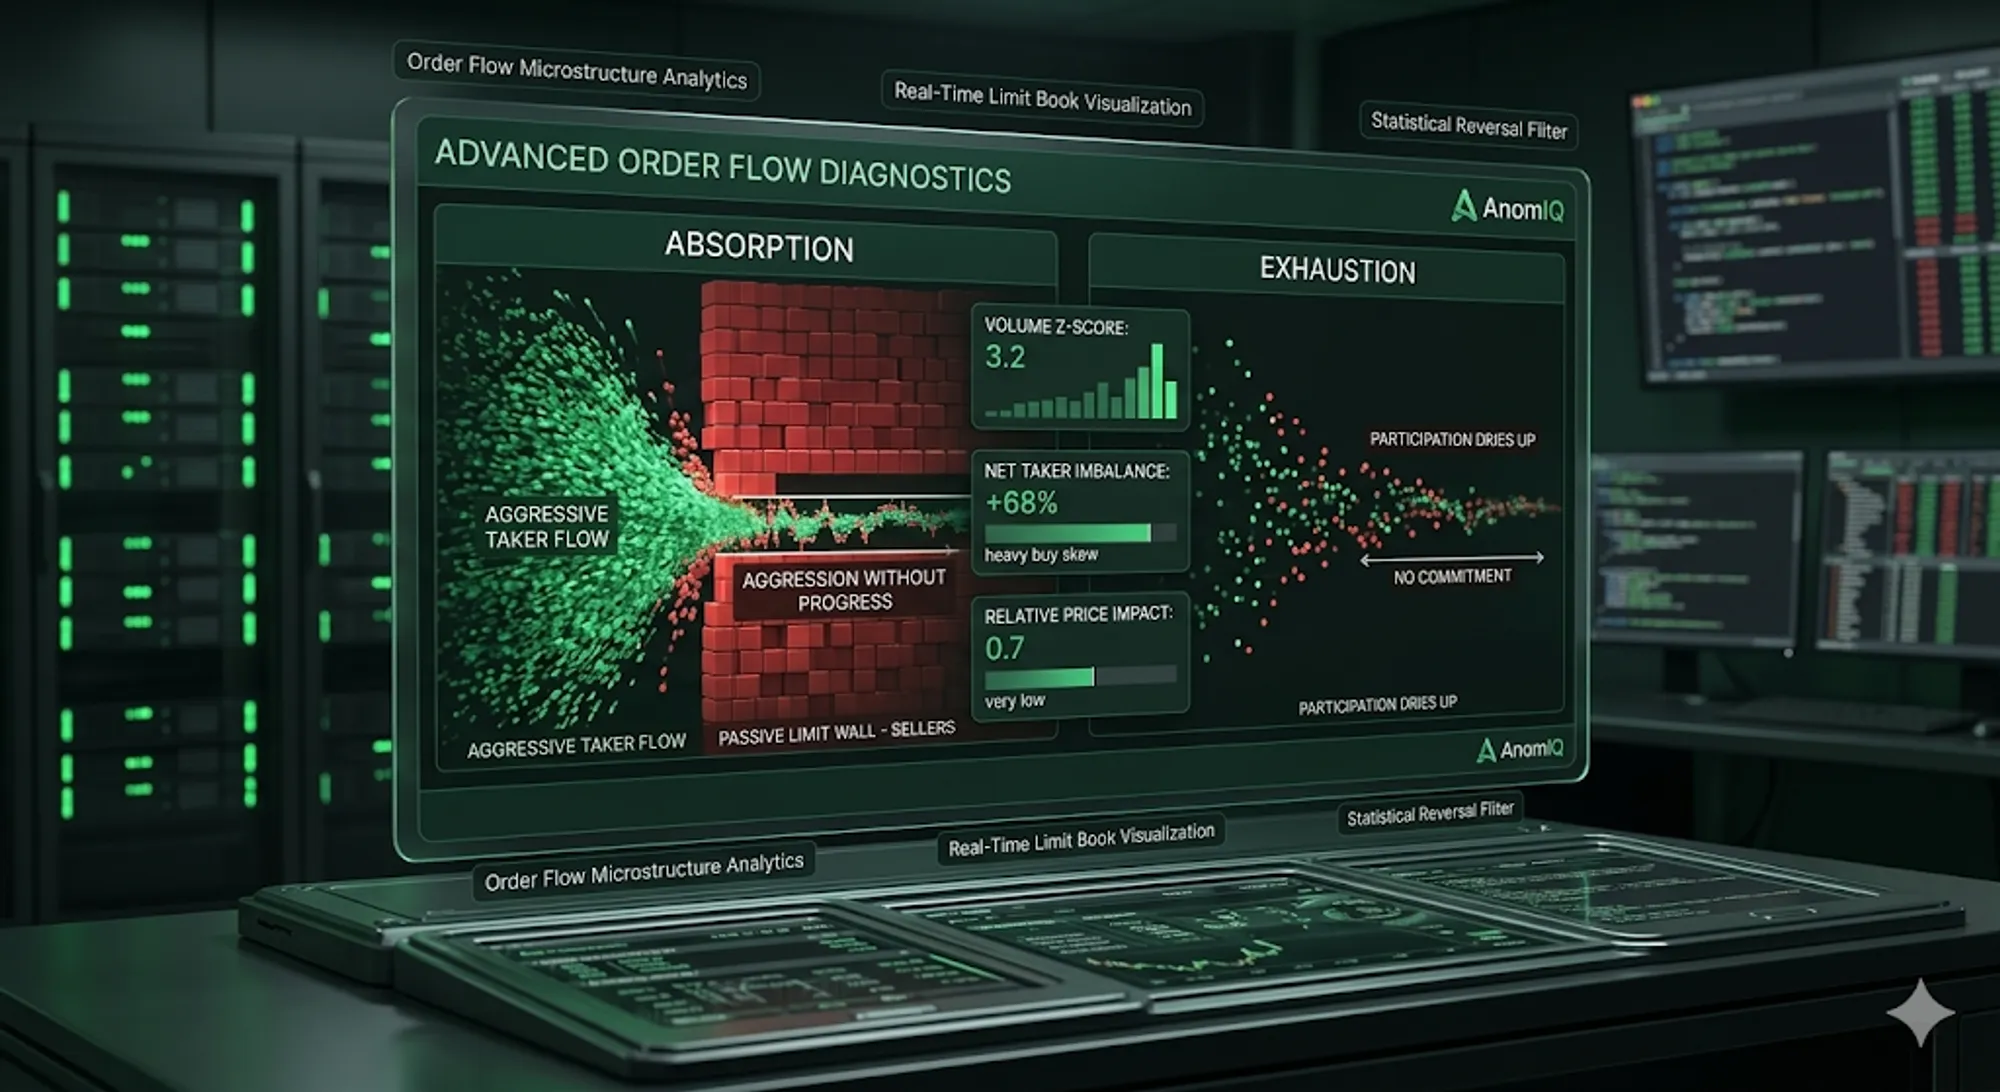
Order flow absorption means large volume enters the market without proportional price movement. The measurable signature is a high Volume Z-Score with Net Taker Imbalance near zero. Both sides commit size at the same level, and neither gains control. Climactic exhaustion starts when one side runs out of capital first and price resolves in the opposite direction.
For the conceptual framework behind these metrics, see Part 1 onorder flow absorption and exhaustion. For the broader scanner workflow, start with Crypto Order Flow Trading: Taker Flow and Scanner Rules. For the standalone volume-normalization workflow, use Z-Score Volume Anomaly Detection in Trading.
Absorption vs Exhaustion in Order Flow: Quick Answer
Absorption vs exhaustion in order flow trading is a question of containment versus decay. Absorption appears when elevated volume fails to move price efficiently. Exhaustion appears after a move has already extended and the directional side starts fading, flipping, or getting matched by the other side.
| Pattern | Volume imbalance | Net Taker Imbalance | Price response | Read |
|---|---|---|---|---|
| Absorption | High volume, often one side rising into the other | Near zero or collapsing | Limited movement | Opposing liquidity is containing the flow |
| Exhaustion | The prior dominant side fades or gets matched | Collapses, flips, or loses persistence | Move stalls or reverses | Directional participation is drying up |
| Momentum | Volume and taker flow stay aligned | Directional and persistent | Price moves with volume | Continuation remains intact |
An order flow exhaustion volume imbalance often shows up when Sell Volume Z-Score overtakes Buy Volume Z-Score near a rising high, or Buy Volume Z-Score overtakes Sell Volume Z-Score near a falling low, while Net Taker Imbalance moves toward zero instead of confirming the move.
Decision Rules at a Glance
Detecting which type of absorption you have:
- Total Volume Z-Score elevated + Net Taker Imbalance near zero + Buy Volume Z-Score ≈ Sell Volume Z-Score → Two-sided exhaustion. Both sides are spending size at the same level. Do not take a position. Wait for one side to stop showing up.
- Sell Volume Z-Score crosses above Buy Volume Z-Score + Net Taker Imbalance near zero + price still rising → Sell-side absorbing the buyer rally. Sellers are structurally dominant. This is the first directional warning, typically 2–3 minutes before the high.
During the event:
- 4+ consecutive elevated-Z minutes + Net Taker Imbalance oscillating near zero → Standoff active. No directional edge exists until something breaks. Wait. Do not guess.
- Z-Score drops >80% in one minute → Standoff ending. Direction is not yet confirmed. Watch Net Taker Imbalance for the next 2 minutes.
Confirming direction:
- On 5m: Net Taker Imbalance > 25% for 2+ consecutive minutes after Z collapse → Direction confirmed on the short timeframe.
- On 15m: Net Taker Imbalance sign change sustained across 2+ readings → Direction confirmed on the medium timeframe. Persistence matters more than magnitude. -4% sustained beats -40% for one minute.
Window mechanics:
- 5m Total Volume Z-Score collapses suddenly after a single extreme candle → Window rollout, not signal fade. The breakout minute has rolled out of the 4+1 bar window. Switch to 15m as the primary monitoring timeframe; it retains the event volume longer.
Ruling out absorption:
- Net Taker Imbalance sustained above +40% with price moving in the same direction → Momentum, not absorption. The directional side controls the tape. Different read, different expectation.
These three examples show exact readings, minute-by-minute Deep Dive data, and the price outcome that followed.
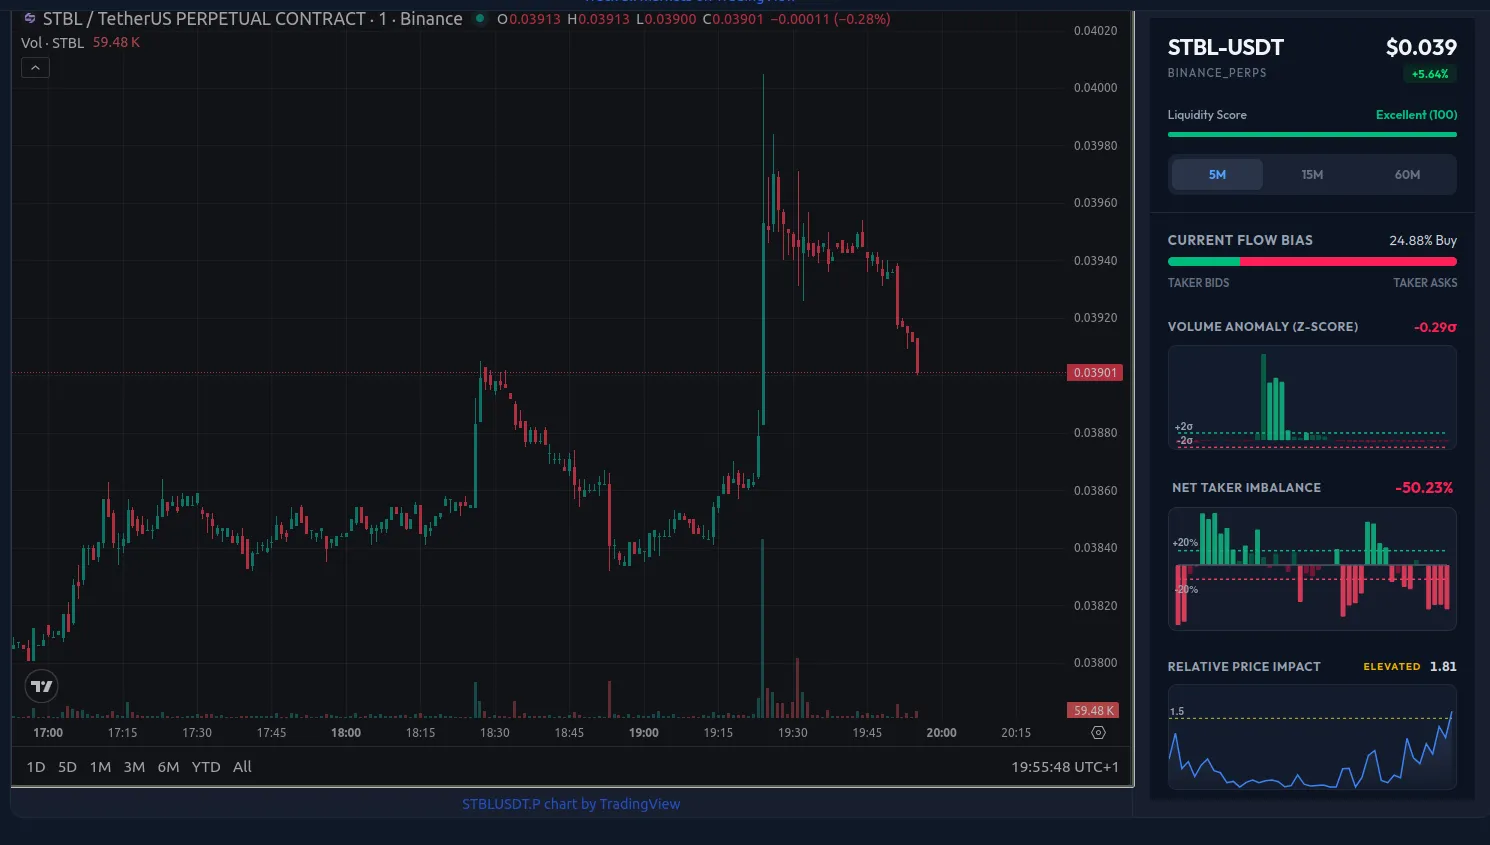
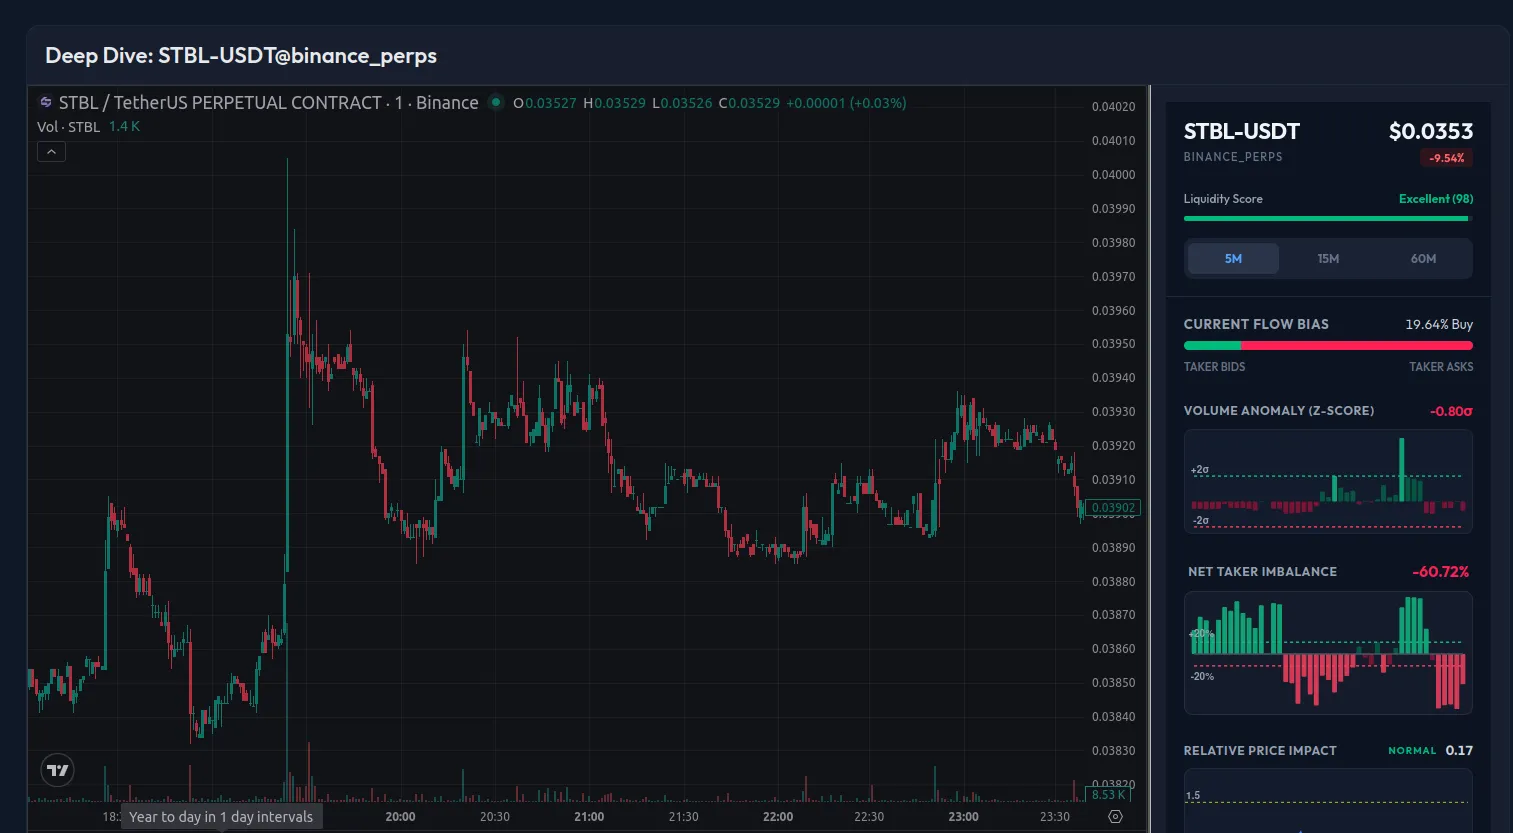
Example 1: STBL-USDT Perpetual, Two-Sided Climactic Exhaustion at the Top
Asset: STBL-USDT Perpetual (Binance) Date: March 17, 2026, event window 18:24–18:27 UTC Market Context: STBL traded in a tight $0.03835 to $0.03883 range for more than 60 minutes from 17:11 to 18:22 UTC. At 18:23, Volume Z-Score ticked up to 1.88 and price pushed to $0.03879. One minute later, the scanner fired.
The Deep Dive Reading
All three metrics triggered for four straight minutes:
| UTC Time | Price | Volume Z-Score | Net Taker Imbalance | Relative Price Impact | 5m Move |
|---|---|---|---|---|---|
| 18:24 | $0.03953 | 23.86 | +11.2% | 0.093 | +2.33% |
| 18:25 | $0.03951 | 16.00 | -3.9% | 0.136 | +2.30% |
| 18:26 | $0.03970 | 17.25 | +16.2% | 0.151 | +2.72% ← peak |
| 18:27 | $0.03958 | 16.15 | +0.6% | 0.116 | +1.93% |
What the Data Said
A Volume Z-Score of 23.86 means volume ran almost 24 standard deviations above the historical mean. On most assets, you see that a few times a year at most. With a +2.33% five-minute move, you would expect clear directional control. Instead, Net Taker Imbalance printed +11.2%, -3.9%, +16.2%, and +0.6%. That stayed close to neutral the whole time.
Buyers and sellers both hit the tape in huge size, and neither side gained control. Relative Price Impact confirmed the stalemate. Even with 16x to 24x normal volume, price barely moved per unit of activity, with Relative Price Impact between 0.093 and 0.151 in all four minutes.
In a one-sided absorption event, one passive wall absorbs flow from the other side. This was different. Both sides committed size at the same level and kept cancelling each other out. That is two-sided climactic exhaustion. The standoff only ends when one side stops absorbing the cost. After the breakout from the hour-long range, buyers stopped first.
Reading the Deep Dive During the Position
The alert hit at 18:24 UTC. The decision came after that. Was the event still live, had it already burned out, or were sellers about to take it over? The Deep Dive gave the answer minute by minute:
| UTC | Price | 5m Volume Z-Score | 5m Net Taker Imbalance | 5m Relative Price Impact | 5m Move | Reading |
|---|---|---|---|---|---|---|
| 18:24 | $0.03953 | 23.86 | +11.2% | 0.093 | +2.33% | Event active: standoff at full intensity |
| 18:25 | $0.03951 | 16.00 | -3.9% | 0.136 | +2.30% | Still active: imbalance near-zero, no resolution |
| 18:26 | $0.03970 | 17.25 | +16.2% | 0.151 | +2.72% | Still active: price barely moved despite Z=17 |
| 18:27 | $0.03958 | 16.15 | +0.6% | 0.116 | +1.93% | Still active: four consecutive minutes, no winner |
| 18:28 | $0.03953 | 2.75 | -9.6% | 0.005 | -0.03% | Z collapsed: event is ending |
| 18:29 | $0.03950 | 0.95 | +17.9% | 0.029 | -0.08% | Volume back to normal: standoff over |
| 18:30 | $0.03945 | 0.69 | -51.9% | 0.264 | -0.60% | Direction confirmed: sellers now dominating |
| 18:31 | $0.03945 | 2.07 | -11.9% | 0.061 | -0.30% | Directional, declining move continuing |
| 18:33 | $0.03944 | 1.44 | -6.9% | 0.034 | -0.13% | Sustained: no recovery attempt |
The sequence broke into three phases:
Phase 1: Active standoff (18:24–18:27) Z-Score stayed between 16 and 24 for four straight minutes. Imbalance stayed near zero. Neither side won. Price moved from $0.03953 to $0.03958 across the entire window despite one of the biggest volume bursts this asset had printed.
Phase 2: Event ends (18:28–18:29) Z-Score dropped from 16 to 2.75 in one minute, then to 0.95. Volume returned to baseline. That told you the event had ended, but not the direction. The 5m move still sat between -0.03% and -0.08%.
Phase 3: Direction confirmed (18:30 onwards) Imbalance swung to -51.9%, the strongest directional reading in the sequence, and it did so on the sell side. Relative Price Impact recovered to 0.264. Volume started moving price again. The 5m move reached -0.60%. Buyers were gone. Sellers took over.
How to Confirm Direction After an Absorption Event
The alert marks the start of the event. Your decision comes in the next few minutes, when you need to separate event decay from confirmed direction.
At 18:28 UTC, Z-Score had already collapsed, but imbalance was -9.6% and the 5m move was -0.03%. The event had ended, but direction was still unconfirmed. The market had shifted back to baseline behavior.
At 18:30 UTC, imbalance hit -51.9% and the 5m move reached -0.60%. That confirmed seller control.
The 15m and 60m views show how long the move lasted:
15-minute view: pre-event and post-event
The 15m data shows something the 5m view cannot: buyers were already in control before the alert. For the 15 minutes leading into the notification, 15m imbalance stayed buy-biased at 25% to 60% and price responded. Then at 18:24, just as 5m Z-Score hit 23.86, 15m imbalance collapsed from +45% to +12%. Sellers stepped in right at peak buying pressure.
After the event, the 15m view filled in the next stage:
| UTC | 15m Volume Z-Score | 15m Net Taker Imbalance | 15m Move | Reading |
|---|---|---|---|---|
| 18:23 | 0.15 | +45.6% | +0.75% | Pre-event: buyers in control |
| 18:26 | 3.75 | +18.2% | +3.30% | Event peak |
| 18:31 | 5.67 | +0.8% | +2.10% | Z still elevated, move declining |
| 18:38 | 2.35 | -12.5% | -0.33% | 15m move flips negative |
| 18:51 | -0.24 | -35.6% | -0.56% | Sellers now dominant on 15m |
| 18:55 | -0.23 | -27.5% | -1.17% | Price at $0.03899, full -1.79% from peak |
The 15m view confirmed direction 14 minutes after the 5m alert, at 18:38 instead of 18:24. The 60m view barely registered the event. Its Z-Score only reached 2.36 because the burst was short and concentrated.
Why the 5m Deep Dive matters for position monitoring
The 60m view never gave a useful signal. The 15m confirmed direction at 18:38, fourteen minutes later. The 5m Deep Dive showed the event still active at 18:24, the Z-Score collapse at 18:28, and the handoff to sellers at 18:30.
The 5m view confirmed direction in six minutes; the 15m view took fourteen. That difference cuts time spent in an unresolved state.
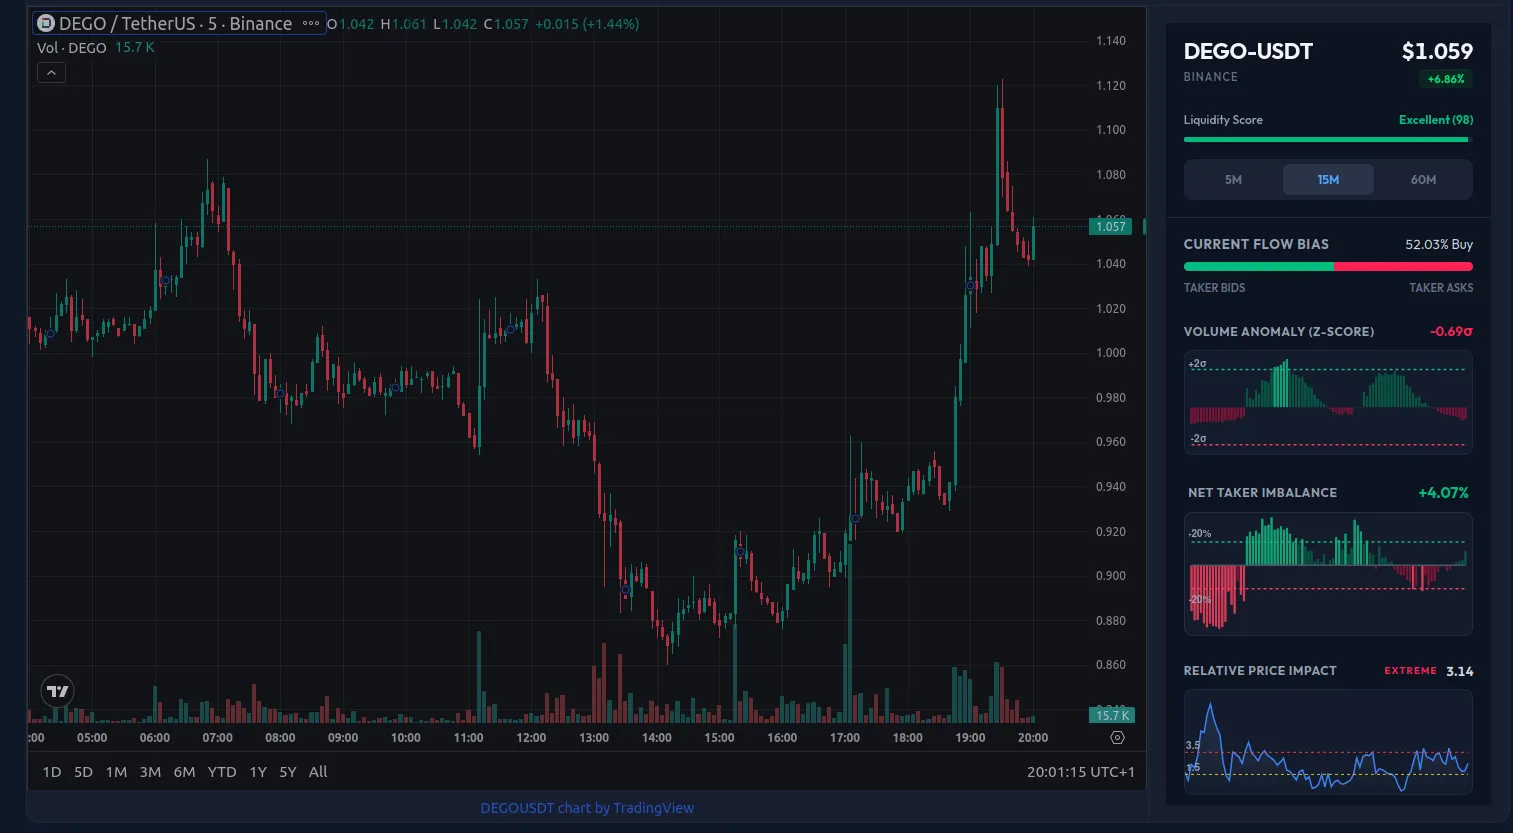
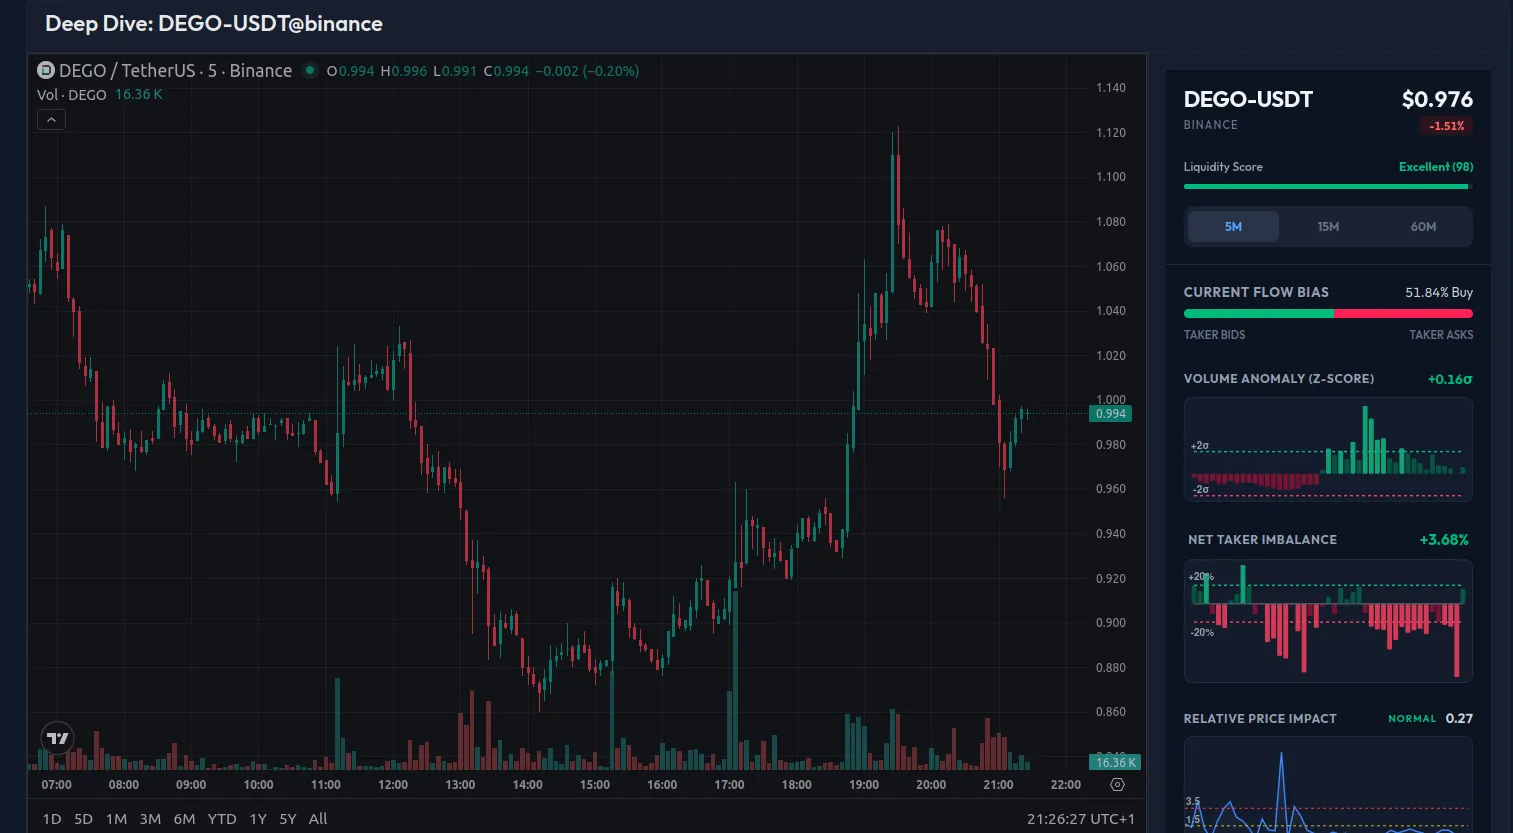
Example 2: DEGO-USDT, Sell-Side Absorption at the Second High
Asset: DEGO-USDT (Binance Spot) Date: March 18, 2026, primary event 17:45–18:00, second rally 18:24–18:30 Market Context: DEGO made a sharp first move from 17:45 to 18:00 UTC, climbing about 15% from a low near $0.970. Then it spent 24 minutes consolidating between $1.024 and $1.049 with no meaningful directional flow on either timeframe. At 18:24, a fresh buy-side signal appeared and price broke higher, reaching $1.118 by 18:30. That set a new local high for the session. One minute later, the move reversed. By the 18:59 close, price had fallen to $1.042 and recovered only a small part of the peak.
This example covers two decisions: separating exhaustion from accumulation during cooldown, and identifying a weak second rally before price confirms it.
Reading the Cooldown: Exhaustion, Not Accumulation
The 24-minute pause from 18:00 to 18:24 determined how to interpret the next alert.
15-minute timeframe: Volume Z-Score fell from 2.27 at 18:00 to about 0.08 by 18:15. Net Taker Imbalance dropped from 33.7% at 18:00 to 2.7% to 3.3% by 18:11 to 18:13. Both the volume and the directional bias behind the first move were back at baseline within 15 minutes.
5-minute timeframe (from 18:15): Volume Z-Score stayed negative through the whole consolidation, from -0.27 to -0.62. Volume ran below its own historical average. No hidden buy pressure was building.
60-minute timeframe: Buy Volume Z-Score stayed elevated at 1.41 to 2.39 through the cooldown. That can look like sustained interest, but it was mechanical. The hourly window still contained the heavy volume from 17:45 to 18:00. As lower-volume minutes rolled in, that reading decayed on its own. It did not mark fresh demand.
Negative 5m Volume Z-Score, collapsed 15m Net Taker Imbalance, and falling 15m Volume Z-Score gave a clean exhaustion read. All three timeframes pointed to drying participation with no fresh directional flow.
At 18:24, the state changed. The 5m showed Net Taker Imbalance at 53.6%, Buy Volume Z-Score at 1.11, and price lifting from $1.036 to $1.049. Concentrated buying hit the tape on above-average volume after 24 quiet minutes. The scanner fired on a valid re-ignition signal, and the second rally started there.
The Deep Dive Reading: Second Rally (18:27–18:30)
The second rally made a new session high. Price looked clean, but order flow had started to deteriorate. Sell Volume Z-Score kept building while price still climbed:
| UTC | Price | 5m Buy Volume Z-Score | 5m Sell Volume Z-Score | 5m Net Taker Imbalance | 5m Relative Price Impact |
|---|---|---|---|---|---|
| 18:25 | $1.063 | 0.48 | -0.20 | +46.9% | 2.224 |
| 18:26 | $1.066 | 0.42 | -0.14 | +42.2% | 2.255 |
| 18:27 | $1.092 | 2.11 | 3.00 | +17.1% | 1.573 |
| 18:28 | $1.101 | 1.15 | 1.78 | +15.3% | 2.119 |
| 18:29 | $1.110 | 1.81 | 4.55 | -2.6% | 1.194 |
| 18:30 | $1.118 ← peak | 1.90 | 4.82 | -2.9% | 1.374 |
At 18:25 and 18:26, the rally still looked directional. Net Taker Imbalance stayed above 40%, Buy Volume Z-Score was low but positive, and price kept rising. At 18:27, Sell Volume Z-Score jumped to 3.00 while Buy Volume Z-Score hit 2.11. Sellers stepped in aggressively while buyers were still pushing. Net Taker Imbalance fell from 42% to 17% in one minute.
By 18:29, Sell Volume Z-Score had reached 4.55 against Buy Volume Z-Score of 1.81. Net Taker Imbalance was -2.6%. Price was still rising, from $1.049 to $1.110 in six minutes, but the flow had stopped being directional. At the actual peak at 18:30, price printed $1.118, Sell Volume Z-Score reached 4.82, and Buy Volume Z-Score was only 1.90. Net Taker Imbalance stayed near zero at -2.9%.
What the Data Said
The first rally from 17:45 to 18:00 was directional. Buyers controlled the tape and price responded. The second rally from 18:24 was different from the start. Buy Volume Z-Score peaked at 2.11, which kept buyers in the move but never put them in clear control. Sell Volume Z-Score reached 4.82 at the peak. Sellers were running at more than double the buy-side anomaly while price still made new highs.
Net Taker Imbalance near zero at 18:30, at -2.9%, confirmed the stalemate. Buyers pushed price to $1.118, but sellers matched them in almost equal size. That is absorption. A passive or distributed sell-side force absorbed aggressive buy flow at the level. Buyers ran out of capital first. The sell-side order stayed in place.
Relative Price Impact supports the supply-zone read. At 18:29 and 18:30, Relative Price Impact printed 1.194 and 1.374. With Sell Volume Z-Score at 4.55 and 4.82, those values point to real supply sitting in the book around $1.110 to $1.118.
The difference from Example 1 is asymmetry. In Example 1, both Volume Z-Score readings were extreme and close to each other. Here, Sell Volume Z-Score more than doubled Buy Volume Z-Score at the high. That is sell-side absorption of a buyer rally. One side overpowers the other structurally while Net Taker Imbalance stays near zero because buyers are still active, just losing.
Reading the Deep Dive During the Second Rally
The scanner fired at 18:24 on a real buy-side re-ignition. The next six minutes showed the rally structure.
| UTC | Price | 5m Volume Z-Score | 5m Sell Volume Z-Score | 5m Net Taker Imbalance | 5m Relative Price Impact | Reading |
|---|---|---|---|---|---|---|
| 18:24 | $1.049 | 0.77 | 0.02 | +53.6% | 1.085 | Buy-side re-ignition: directional, concentrated |
| 18:25 | $1.063 | 0.26 | -0.20 | +46.9% | 2.224 | Rally continues: buy dominant, sell side absent |
| 18:26 | $1.066 | 0.24 | -0.14 | +42.2% | 2.255 | Buyers still in control, volume moderate |
| 18:27 | $1.092 | 2.48 | 3.00 | +17.1% | 1.573 | Sell Volume Z-Score overtakes Buy Volume Z-Score: sellers entering aggressively |
| 18:28 | $1.101 | 1.40 | 1.78 | +15.3% | 2.119 | Both sides elevated, Net Taker Imbalance fading toward neutral |
| 18:29 | $1.110 | 2.81 | 4.55 | -2.6% | 1.194 | Sell Volume Z-Score 4.55 vs Buy Volume Z-Score 1.81, absorption at price high |
| 18:30 | $1.118 | 2.97 | 4.82 | -2.9% | 1.374 | Peak price: sell side more than double buy side |
| 18:31 | $1.078 | 2.67 | 5.56 | -24.5% | 0.409 | Price breaks: buyers exhausted, sell flow surges |
| 18:32 | $1.095 | 2.90 | 3.86 | +11.8% | 0.181 | Bounce attempt: high volume, price barely moves |
| 18:33 | $1.088 | 1.45 | 2.53 | -4.5% | 0.888 | Volume fading, sell side still elevated |
| 18:37 | $1.074 | -0.00 | 1.00 | -55.0% | 1.564 | Below-normal volume, sellers dominating thin tape |
| 18:43 | $1.056 | -0.80 | 0.30 | -50.4% | 1.513 | Sustained directional sell, no recovery attempts |
18:27: The first warning. Sell Volume Z-Score crossed above Buy Volume Z-Score, 3.00 versus 2.11, while price still rose by $0.026 in that minute. Net Taker Imbalance dropped from 42% to 17%. Sellers entered the tape as aggressive participants for the first time in the rally. That was the first clear sign of a structural shift.
18:29–18:30: The absorption read. Sell Volume Z-Score printed 4.55 and then 4.82. Buy Volume Z-Score printed 1.81 and 1.90. Net Taker Imbalance sat at -2.6% and -2.9%. Price still made new highs, but sellers matched the flow driving those highs almost dollar for dollar. At 18:29, the 5m showed more sell-side statistical deviation than any point in the first rally while price still drifted up.
18:32: The bounce got absorbed. After the break from $1.118 to $1.078 at 18:31, buyers stepped back in at $1.095 with Volume Z-Score of 2.90. That was real volume. Relative Price Impact came in at 0.181, so the volume barely moved price. The bounce ran into the same sell-side structure that ended the rally. Supply still sat overhead.
How to Tell a Real Signal From a False Continuation
The scanner caught real activity at 18:24. Net Taker Imbalance printed 53.6% on concentrated buy flow, but that alone did not confirm clean continuation.
At 18:25 and 18:26, the Deep Dive showed clean buy dominance. Sell Volume Z-Score was basically absent. At that point, the rally still looked sound.
At 18:27, Sell Volume Z-Score crossed Buy Volume Z-Score while price was still rising. That was the first compositional warning. Sellers had become active participants, and Net Taker Imbalance dropping from 42% to 17% in one minute confirmed the shift.
At 18:29, the market answered the question. Sell Volume Z-Score printed 4.55 against Buy Volume Z-Score at 1.81, Net Taker Imbalance was -2.6%, and price was $1.110. Sellers were running the larger anomaly while buyers were still forcing price upward. That mix of strong sell-side deviation, near-zero Net Taker Imbalance, and price still near the highs is the real-time absorption read.
The 15-minute view added confirmation. During the same window:
| UTC | 15m Volume Z-Score | 15m Sell Volume Z-Score | 15m Net Taker Imbalance | 15m 5m Move | Reading |
|---|---|---|---|---|---|
| 18:26 | 0.03 | -0.23 | +29.3% | +2.11% | 15m still buy-biased |
| 18:29 | 1.18 | 1.08 | +10.8% | +6.83% | Sell Volume Z-Score building on 15m |
| 18:31 | 1.63 | 1.89 | -3.2% | +4.15% | 15m move still positive but Net Taker Imbalance flipped |
| 18:37 | 1.92 | 2.22 | -3.6% | +3.67% | 15m Sell Volume Z-Score elevated, move declining |
| 18:41 | 1.18 | 1.62 | -12.5% | -2.74% | 15m move turns negative |
| 18:46 | 0.21 | 0.62 | -22.2% | -4.64% | 15m confirms sustained sell dominance |
The 15m move turned negative at 18:41, which was 17 minutes after the alert and 11 minutes after the peak. The 5m Deep Dive had already shown Sell Volume Z-Score overtaking Buy Volume Z-Score at 18:27, the absorbed bounce at 18:32, and directional Net Taker Imbalance at 18:37. On the 5m, the warning was there three minutes before the high.
The Two-Event Structure
The cooldown from 18:00 to 18:24 confirmed that the first event had ended. When 5m Volume Z-Score sits below baseline and 15m Net Taker Imbalance collapses toward zero, the scanner can treat the next buy-side alert as a fresh event instead of a continuation.
The second alert at 18:24 was fresh, and the scanner was right to fire. The next six minutes in Sell Volume Z-Score separated this move from a sustained continuation. Price alone hid that shift; the Deep Dive exposed it.
The drop from $1.118 to $1.042, a 6.8% decline, unfolded over 29 minutes. The vol-adjusted absorption signal appeared at 18:27, three minutes before the high.
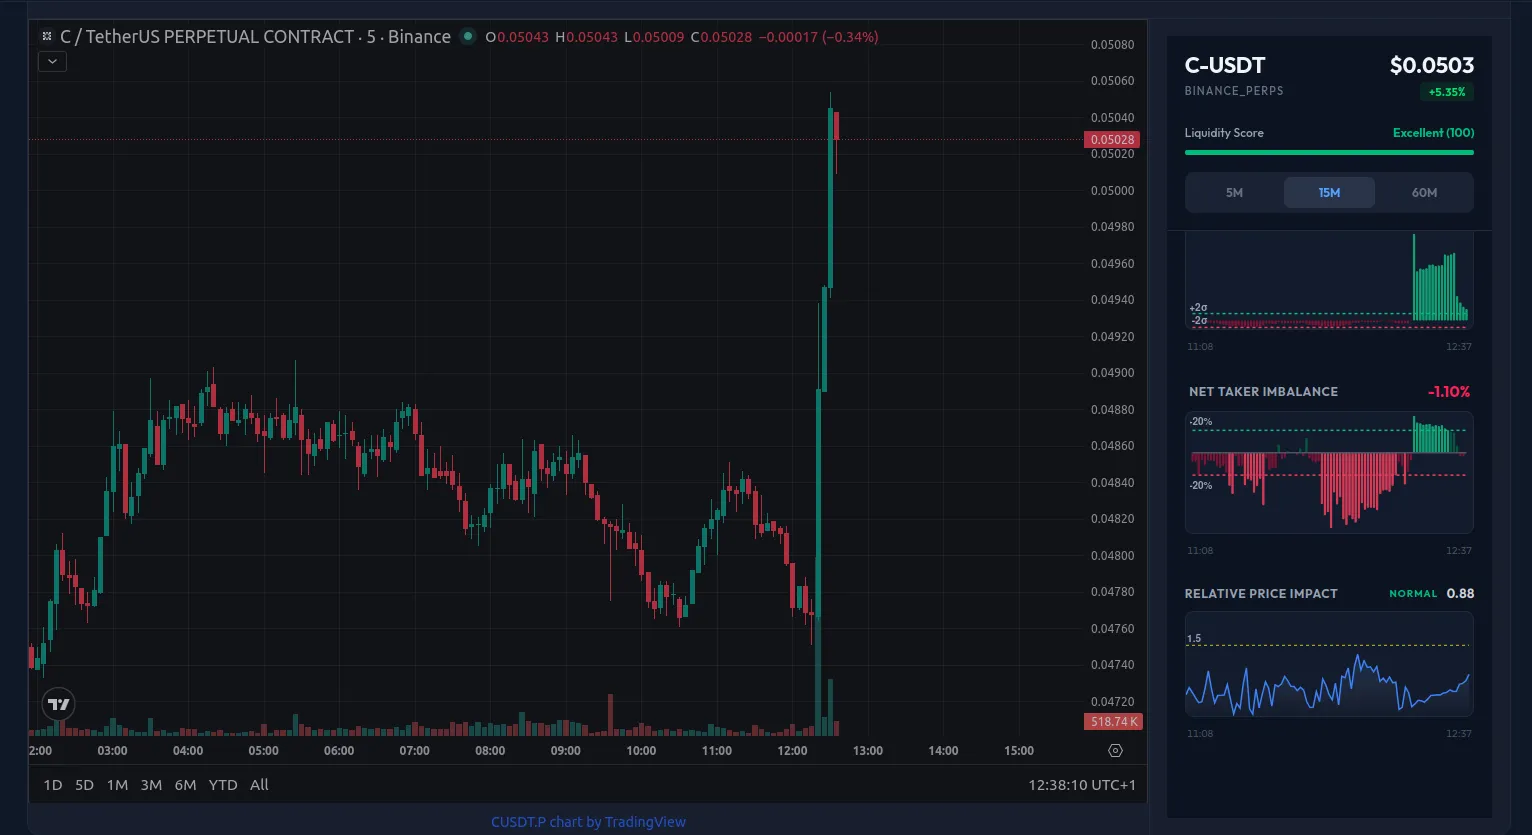
Example 3: C-USDT Perpetual, Drift Reversal With a Shakeout
Asset: C-USDT Perpetual (Binance) Date: March 24, 2026, event window 05:39–11:38 UTC Market Context: C-USDT had been in a quiet sell drift since at least 05:39 UTC. This was steady directional pressure, not a panic flush. Price moved from $0.04865 to $0.04785 over roughly 3.5 hours. On the 15m timeframe, Buy Volume Z-Score averaged -1.4 to -1.8 across the whole stretch. Buy-side volume ran below its own historical mean. Sellers controlled the tape.
At 09:07 UTC, a brief 5m buy spike with Volume Z-Score at 134.86 got absorbed with no price response. The sell drift continued for two more hours. At 11:17, price printed a new six-hour low at $0.04757. Three minutes later, one candle reversed the whole structure.
In this case, the exhaustion signal confirmed the peak instead of leading it. The 15m produced the read, and 5m window mechanics explain the timing.
Wave 1: The Invisible First Spike (09:07 UTC)
The first anomaly came at 09:07: 5m Buy Volume Z-Score at 134.86, Sell Volume Z-Score at -0.22, and Relative Price Impact at 0.048. That was an extreme volume event with almost no upward price response. Price kept falling to $0.04771.
| UTC | Price | 5m Buy Volume Z-Score | 5m Sell Volume Z-Score | 5m Net Taker Imbalance | 5m Relative Price Impact | Outcome |
|---|---|---|---|---|---|---|
| 09:07 | $0.04785 | 134.86 | -0.22 | n/a* | 0.048 | Price → $0.04771 ↓ |
Buy Volume Z-Score at 134.86 means roughly 135 standard deviations above the historical mean. You might never see that twice in an asset’s full history. Under normal order flow, that kind of buy volume moves price. Relative Price Impact at 0.048 says it did not. The market absorbed the flow at that level.
The 5m history in the JSON only covers the last 45 minutes of the session. The 09:07 data was observed live, but the stored snapshot does not preserve the Net Taker Imbalance value from that minute. With Buy Volume Z-Score at 135σ and Sell Volume Z-Score at -0.22, buyers dominated taker flow. The missing Net Taker Imbalance percentage does not change the absorption read.
The 5m spike was too short and too concentrated to show up on the 15m or 60m. On those windows, the 09:07 area looks like nothing happened. Without the 5m Deep Dive, you would miss both the spike and the absorption that killed it.
The Sell Drift: 15m and 5m Metrics Through the Event Window
Before the breakout, the 15m data from 10:23 to 11:19 set the baseline. Buy and Sell Volume Z-Score both stayed below their historical means, and Net Taker Imbalance was mostly negative. No sustained buy-side anomaly appeared anywhere in the drift.
| UTC | Price | 15m Buy Volume Z-Score | 15m Sell Volume Z-Score | 15m Net Taker Imbalance | Reading |
|---|---|---|---|---|---|
| 10:23 | $0.04838 | -1.39 | -1.31 | -11.85% | Both sides below baseline: drift continuing |
| 10:43 | $0.04818 | -0.55 | -0.90 | +3.70% | Near neutral, below-average activity |
| 11:03 | $0.04776 | -1.10 | +0.39 | -45.16% | Sell side slightly elevated, price falling |
| 11:19 | $0.04768 | -0.15 | -0.23 | -6.78% | Near baseline: final minute before shakeout |
The 60m showed Buy Volume Z-Score between -0.63 and -1.09 the whole time. Hourly buy volume stayed below baseline, which confirmed the sell-dominant regime across all timeframes.
Inside that window, the 5m showed one brief burst of active selling around 11:00:
| UTC | Price | 5m Buy Volume Z-Score | 5m Sell Volume Z-Score | 5m Net Taker Imbalance | Reading |
|---|---|---|---|---|---|
| 10:58 | $0.04799 | -0.71 | 3.48 | -75.44% | Active sell-side pressure on 5m |
| 11:00 | $0.04791 | 0.04 | 7.09 | -67.75% | 5m Sell Volume Z-Score peaks: aggressive selling |
| 11:03 | $0.04776 | 1.17 | 4.53 | -37.35% | Sell pressure declining |
The 5m sell spike at 11:00, with Volume Z-Score at 7.09 and Net Taker Imbalance at -67.75%, was the most active part of the drift. It pushed price from $0.04799 to $0.04776 and then faded. By 11:19, every timeframe was back near baseline, with 15m Buy Volume Z-Score at -0.15, Sell Volume Z-Score at -0.23, and Net Taker Imbalance at -6.78%.
The Shakeout and Breakout
At 11:17 UTC, price printed a new six-hour low at $0.04757. The 60m Buy Volume Z-Score was -1.09 and Net Taker Imbalance was -28.5%. Every timeframe still leaned sell-side. At 11:20, one one-minute candle printed +2.9%. That flipped 60m Buy Volume Z-Score from -0.87 to +7.38.
| UTC | Price | 60m Buy Volume Z-Score | 60m Net Taker Imbalance | Reading |
|---|---|---|---|---|
| 11:17 | $0.04757 ← low | -1.09 | -28.5% | New 6-hour low: 60m still sell-dominated |
| 11:18 | $0.04758 | -1.06 | -25.73% | Shakeout holding |
| 11:19 | $0.04768 | -0.87 | -21.56% | Final minute before breakout |
| 11:20 | $0.04898 | +7.38 | +24.38% | Breakout: +2.9% in one minute, 60m flips |
The shakeout at 11:17 likely triggered stops from traders who were short from the earlier drift. The market absorbed that selling during the same two minutes that produced the 60m flip. On the 60m, it reads as one extraordinary buying event. On the 5m, the breakout minute showed Buy Volume Z-Score at 134.86 and Sell Volume Z-Score at 44.61. Both sides were extreme, but buyers still led, with Net Taker Imbalance at +34.31%.
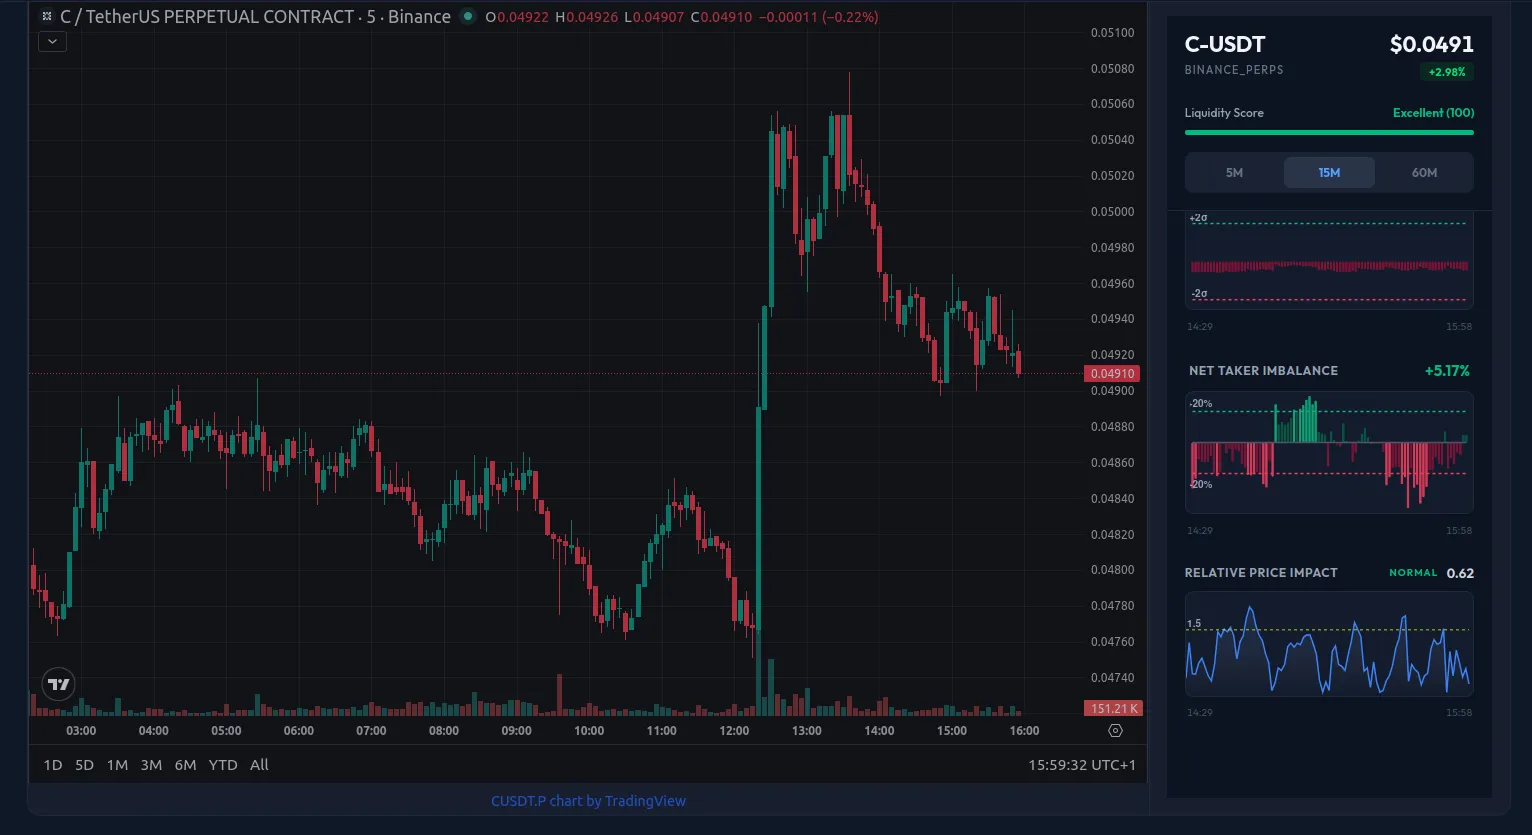
Reading the Deep Dive: Breakout and Exhaustion (11:20–11:38 UTC)
After the +2.9% candle at 11:20, the task changed from spotting momentum to testing whether the move could extend.
The 5m view from breakout to peak:
| UTC | Price | 5m Buy Volume Z-Score | 5m Sell Volume Z-Score | 5m Net Taker Imbalance | 5m Relative Price Impact | Reading |
|---|---|---|---|---|---|---|
| 11:20 | $0.04898 | 134.86 | 44.61 | +34.31% | 0.05 | Breakout: both sides extreme, buy dominant |
| 11:23 | $0.04876 | 76.39 | 28.48 | +28.51% | 0.07 | Breakout window active: 11:20 still in the 5m window |
| 11:27 | $0.04925 | 0.06 | 0.26 | +0.34% | 0.76 | 5m window cleared: breakout minute rolled out, metrics collapse |
| 11:34 | $0.05045 ← peak | 0.59 | 0.91 | +12.23% | 0.57 | Price peak: Sell Volume Z-Score above Buy Volume Z-Score on 5m |
| 11:38 | $0.05036 | -0.20 | 0.13 | -24.99% | 0.17 | Net Taker Imbalance negative: extension stalling |
The 5m rolling window, four completed minutes plus one in progress, still included the 11:20 breakout minute through 11:23. By 11:27, that minute had rolled out. Buy Volume Z-Score collapsed from 76.39 to 0.06 in a single window shift. At 11:27, the 5m looked close to baseline even though price still sat at $0.04925 and the 15m stayed elevated.
The 15m carried the full post-breakout sequence:
| UTC | Price | 15m Buy Volume Z-Score | 15m Sell Volume Z-Score | 15m Net Taker Imbalance | 15m Move | Reading |
|---|---|---|---|---|---|---|
| 11:20 | $0.04898 | 31.17 | 15.51 | +32.83% | +2.62% | 15m breakout: buy dominant |
| 11:23 | $0.04876 | 17.54 | 10.09 | +25.0% | +1.94% | Buy Volume Z-Score elevated, Sell Volume Z-Score lower |
| 11:27 | $0.04925 | 18.62 | 10.80 | +24.76% | +3.34% | Buy still dominant on 15m |
| 11:34 | $0.05045 ← peak | 6.50 | 6.94 | +6.27% | +3.09% | Sell Volume Z-Score crosses Buy Volume Z-Score at price peak |
| 11:38 | $0.05036 | 2.20 | 3.99 | -4.53% | +2.99% | Net Taker Imbalance negative: exhaustion confirmed |
On the 15m, Sell Volume Z-Score at 6.94 first crossed Buy Volume Z-Score at 6.50 at 11:34, the same minute price peaked at $0.05045. Net Taker Imbalance dropped to +6.27%, which put it close to neutral. By 11:38, Net Taker Imbalance had turned negative at -4.53% while the 15m move still held +2.99% from the window open. That told you momentum was fading without a hard flush.
At 11:38, the 60m still showed Buy Volume Z-Score above Sell Volume Z-Score, 5.63 versus 4.65. That confirmed the breakout itself was real and the reversal was gradual, not a straight flush.
Why the 5-Minute Window Rollout Changes the Post-Breakout Read
This sequence depends on platform mechanics. A 5m-only read can miss the post-breakout state.
At 11:03, the read was straightforward. The 15m showed Buy Volume Z-Score at -1.10, Sell Volume Z-Score at +0.39, and Net Taker Imbalance at -45.16%. The sell drift was still in force. No buy-side anomaly was building. Waiting was the trade.
After the 11:20 breakout, the 5m Deep Dive still showed Buy Volume Z-Score at 134.86 and Sell Volume Z-Score at 44.61 through 11:23 because the breakout minute was still inside the 4+1 minute window. At 11:27, it rolled out. The 5m metrics collapsed from 76/28 to 0.06/0.26 in one transition. If you only watched the 5m, the post-breakout market suddenly looked quiet.
The 15m did not clear. At 11:27, Buy Volume Z-Score still sat at 18.62 and Sell Volume Z-Score at 10.80 because the 15m retained the breakout volume longer. For post-breakout monitoring, that made the 15m the operative timeframe.
The exhaustion signal appeared on the 15m at 11:34, with Sell Volume Z-Score at 6.94 against Buy Volume Z-Score at 6.50 and Net Taker Imbalance at +6.27%. That lined up with the price peak. It confirmed the high instead of leading it. At 11:38, Net Taker Imbalance turned negative at -4.53%, which gave the second confirmation that the move was over.
Cross-timeframe confirmation of the full sequence:
| UTC | Price | 15m Buy Volume Z-Score | 15m Sell Volume Z-Score | 15m Net Taker Imbalance | 60m Buy Volume Z-Score | Reading |
|---|---|---|---|---|---|---|
| 10:23 | $0.04838 | -1.39 | -1.31 | -11.85% | -0.63 | Drift: both timeframes below baseline |
| 11:03 | $0.04776 | -1.10 | +0.39 | -45.16% | -1.02 | Sell pressure on 15m, 60m still negative |
| 11:17 | $0.04757 | -0.99 | -0.55 | -28.42% | -1.09 | New 6-hour low: all timeframes sell-dominated |
| 11:20 | $0.04898 | 31.17 | 15.51 | +32.83% | +7.38 | 60m confirms breakout: single candle flips the hour |
| 11:27 | $0.04925 | 18.62 | 10.80 | +24.76% | +4.22 | 15m buy dominant; 5m already at baseline |
| 11:34 | $0.05045 | 6.50 | 6.94 | +6.27% | +5.90 | 15m Sell Volume Z-Score crosses Buy Volume Z-Score at price peak |
| 11:38 | $0.05036 | 2.20 | 3.99 | -4.53% | +5.63 | 15m Net Taker Imbalance negative; 60m Buy Volume Z-Score still above Sell Volume Z-Score (4.65) |
What These Examples Have in Common
These three assets behaved differently, but the underlying read stayed consistent.
Net Taker Imbalance near zero while Volume Z-Score stays elevated is the core tell. A Volume Z-Score of 23.86 can describe a one-sided surge. Pairing it with Net Taker Imbalance at +11.2% changes the read to balance, not control. That separates absorption from momentum.
The directional signal showed up at or before the extreme. In Example 2, Sell Volume Z-Score crossed Buy Volume Z-Score at 18:27 when price was $1.092. The peak came at $1.118 at 18:30, three minutes and 2.4% later. In Example 3, Sell Volume Z-Score crossed Buy Volume Z-Score on the 15m at 11:34, the same minute price peaked at $0.05045. One gave advance warning. The other confirmed the high when it printed. Both matter.
Timeframe decides how long the read stays ambiguous. Example 1 resolved in six minutes. Example 2 needed seventeen minutes on the 15m. Example 3 took longer: sell drift, a 5m sell spike at 11:00, a shakeout to a new six-hour low, a breakout, and then a 15m exhaustion read after the 5m window cleared at 11:27. The 60m confirmed the breakout but lagged the exhaustion.
Independent confirmations raise confidence. Example 3 had Wave 1 absorption at 09:07, with Buy Volume Z-Score at 134.86 and Relative Price Impact at 0.048, the 60m flip from -1.09 to +7.38 at breakout, and the 15m Sell Volume Z-Score cross at the peak. Those were three separate signals across three timeframes. Example 1 had no earlier context. Example 2 had a cooldown that confirmed the first event had finished before the second alert fired.
The broader statistical test backs up that caution: in 16,726 extreme-volume events, volume imbalance itself did not predict direction cleanly, while volatility, Relative Price Impact, distance from the previous point of control, and weaker BTC linkage helped separate larger movers from quieter events.
You can separate false positives with one check. In directional moves, Net Taker Imbalance usually stays above 40% and does not collapse toward zero. Absorption clusters near zero because both sides stay active in similar size. If Volume Z-Score is elevated, Net Taker Imbalance remains directional, and price follows that flow, you are looking at a one-sided surge. The scanner alerts on both; the Deep Dive distinguishes them.
Use a simple operational rule: if Volume Z-Score is elevated and Net Taker Imbalance keeps collapsing toward zero, treat it as absorption and identify which side is taking the other side’s flow.
These examples were captured live. The market validated the framework at different speeds, across different timeframe combinations, and in both directions.
Frequently Asked Questions
What is order flow absorption in crypto trading?
Order flow absorption occurs when large volume enters the market without producing proportional price movement. The measurable signature is a high Volume Z-Score paired with Net Taker Imbalance near zero. Both buyers and sellers are committing size at the same level, and neither side gains control. The standoff ends when one side exhausts its capital; price then resolves in the opposite direction.
What is the difference between absorption and momentum in order flow?
In a momentum move, Net Taker Imbalance stays directional, typically above 40% in the dominant direction, and price moves proportionally with volume. In an absorption event, Net Taker Imbalance stays near zero despite an elevated Volume Z-Score. High volume with near-zero Net Taker Imbalance means both sides are active in similar size. If Volume Z-Score is elevated and Net Taker Imbalance stays directional, you have momentum. If Volume Z-Score is elevated and Net Taker Imbalance collapses toward zero, you have absorption.
What is two-sided climactic exhaustion?
Two-sided climactic exhaustion occurs when both buyers and sellers commit extreme volume at the same price level simultaneously, with both sides’ Volume Z-Score readings high and Net Taker Imbalance near zero. Unlike standard absorption, where one passive wall absorbs flow from the other side, both sides are active in roughly equal size. The standoff ends when one side runs out of fuel. In the STBL-USDT example above, Volume Z-Score stayed between 16 and 24 for four consecutive minutes while Net Taker Imbalance remained near zero, then sellers took over once buyers exhausted.
How do you tell exhaustion from accumulation during a price cooldown?
Check three conditions together: 5-minute Volume Z-Score below baseline (negative), 15-minute Net Taker Imbalance collapsed toward zero, and 15-minute Volume Z-Score falling. When all three are present, participation has dried up instead of building. Accumulation shows rising 5m Volume Z-Score from negative to positive and Net Taker Imbalance building directional bias before price moves. In the DEGO-USDT example, 24 minutes of negative 5m Volume Z-Score and collapsed 15m Net Taker Imbalance confirmed exhaustion, not accumulation, before the second rally fired.
How do you confirm the direction of a move after an absorption event ends?
Watch for three sequential signals after the Volume Z-Score collapses: (1) Volume Z-Score returns to baseline, confirming the event has ended; (2) Net Taker Imbalance swings in one direction, typically past 30-40%; (3) Relative Price Impact recovers, meaning volume is moving price again. In Example 1, direction was confirmed on the 5m at 18:30, six minutes after the initial alert, versus fourteen minutes when waiting for the 15m to confirm.
Why does the 5-minute rolling window matter for post-breakout monitoring?
The 5-minute Deep Dive uses a rolling 4+1 minute window. A single extreme candle with Volume Z-Score above 100 inflates the 5m metrics until that minute rolls out of the window. Once it rolls, the 5m can drop from 76 to 0.06 in a single transition, making the market appear quiet even when the 15m still shows elevated breakout volume. After a large breakout candle, switch to the 15m as the primary monitoring timeframe; it retains event volume longer and gives a cleaner post-breakout exhaustion read.
Monitoring Events in Real Time With AnomIQ
AnomIQ tracks Volume Z-Score, Net Taker Imbalance, and Relative Price Impact across hundreds of markets at once. The scanner is the filter layer. You decide which conditions matter and when an alert should fire. Deep Dive takes over after that. It shows what the market is doing now: is the event still active, is participation fading, is imbalance shifting, or has control already changed hands?
Open AnomIQ, build your scanner, and use Deep Dive to read the market in real time.