
I Had a Year of Tick Data on 8 Symbols. Mean Reversion Still Didn't Survive It.

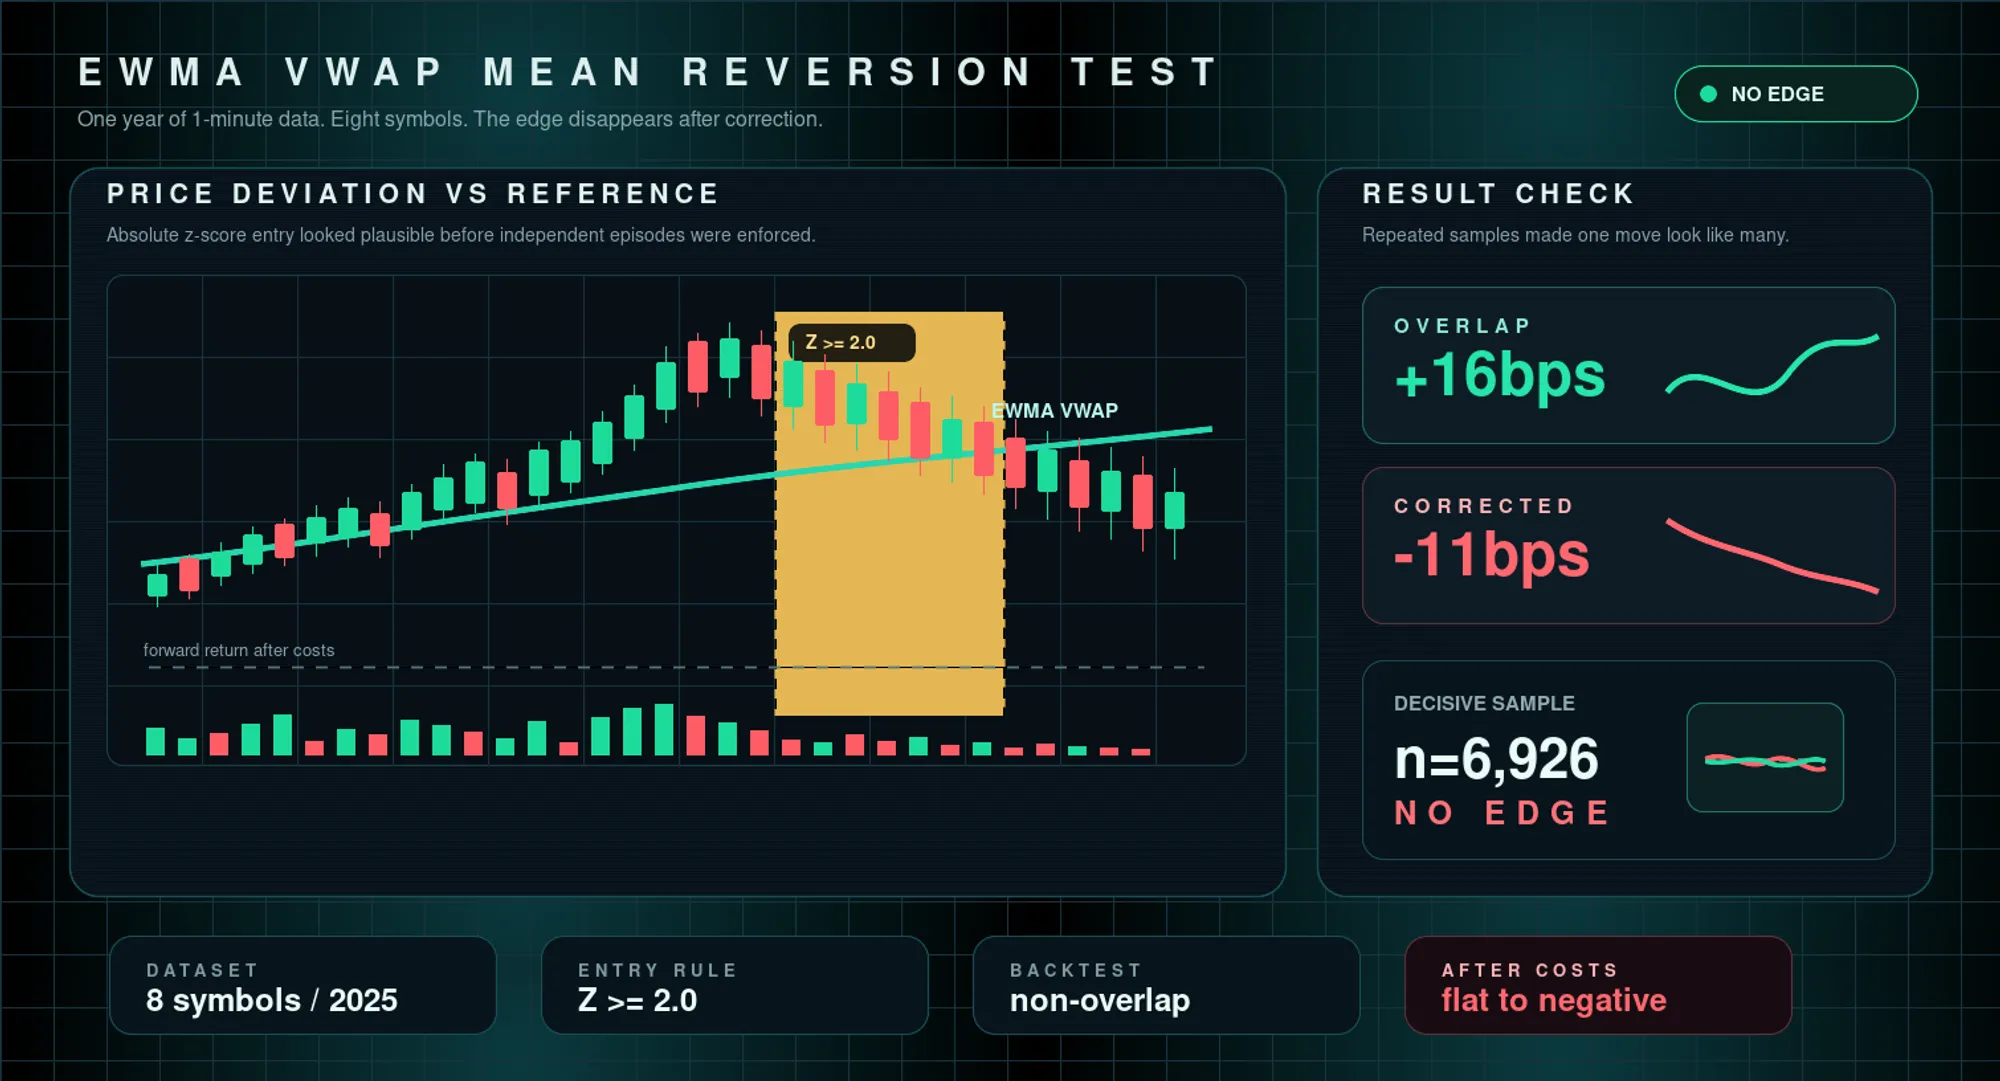
AnomIQ’s simulator replays a full year of tick-level trade data per symbol through the same pipeline that runs the live scanner. That kind of dataset is not common to have sitting around. When I wanted to know whether crypto prices genuinely mean-revert after an extreme move, I did not have to eyeball a chart and guess. I pointed eight symbols and a year of 1-minute data at the question.
For the broader market-wide version of this research, I later testedwhat predicts big crypto moves across 16,726 extreme-volume events, using the same simulator mindset but a wider feature set.
The answer was no. It took eight different attempts to be sure of that, and the closest I came to a real edge is worth showing in full, because it explains exactly why “almost” still doesn’t count.
What Mean Reversion Means Here
Mean reversion is the idea that once price strays far enough from a reference level, it tends to snap back toward it. The reference here is an EWMA VWAP Z-Score: how far the current price sits from a volume-weighted average price that decays smoothly as volume accumulates, instead of resetting at UTC midnight like a standard session VWAP.
The platform used to run a simpler session-VWAP z-score, reset every day at 00:00 UTC. That version was miscalibrated: its standard deviation came out close to 2.0 instead of the 1.0 a z-score is supposed to produce. Rebuilding the reference price as a volume-clock EWMA that never resets, and fixing that calibration, was the first piece of work this test needed. None of the backtest below would mean anything sitting on top of a broken reference price.
Turning the Idea Into a Rule
The rule is mechanical: enter when the EWMA VWAP Z-Score’s absolute value crosses 2.0 (also tested at 2.5 and 3.0), betting on a snap back toward the average. I ran it across 8 symbols, BTC, ETH, SOL, XRP, BNB, DOGE, ADA, and LINK, the full 2025 calendar year, using the simulator’s actual 1-minute bar output from the live anomaly pipeline rather than a hand-picked sample.
Eight symbols and a year of data is not the whole market. It is the slice fully processed at the time, and it is enough to either find a real, well-powered edge or rule the idea out with confidence. Both outcomes are useful.
Trying to Make It Work
Eight different attempts went into testing this rule. Each one failed in a different, informative way.
The first version entered at an EWMA VWAP Z-Score beyond 3.0, required “fast tape” (trade intensity staying elevated through the extreme reading), held for up to 30 minutes, and exited on partial reversion or a z-based stop. It produced 423 qualifying events across the 8 symbols and 12 months combined. That’s too few to trust, and the signs flipped by symbol:
| Symbol | Result |
|---|---|
| LINK | -185bps |
| XRP | +133bps |
Excursion profiling explained part of why. The tight, z-based exit was cutting roughly 64% of eventual winners before the reversion it was betting on had time to complete. Typical winning trades dipped 10-20bps underwater before turning. I rebuilt the exit around that shape: a 35bps stop, with a trailing exit that activates at 20bps profit and gives back 15bps from the peak.
Swapping the z-based exit for the bps-based one produced similar overall performance, but the composition changed underneath it:
| Exit style | BNB result | Other 7 symbols |
|---|---|---|
| z-based | -107bps | baseline |
| bps-based (stop 35 / trail 20, giveback 15) | -2.49bps | cost edge on 6 of 8 |
A single symbol swinging from -107bps to -2.49bps on an exit-rule change is also a sign that some of the original “edge” was one bad month on one coin, not a repeatable pattern.
Then I ran the check the methodology actually calls for before tuning anything further: a model-free read of forward returns bucketed by z-score, with no exit logic at all. At an EWMA VWAP Z-Score beyond 2.5, conditioned on fast tape, and extended out from 30 minutes to 4 hours, the result looked real for the first time. Every horizon from 30 minutes out had a confidence interval excluding zero, and the effect grew with horizon instead of fading:
| Horizon | n | gross return (signed for reversion) |
|---|---|---|
| 30 min | 1,137 | +10.96 ± 8.74bps |
| 1 hr | 1,137 | +14.24 ± 10.26bps |
| 2 hr | 1,137 | +21.14 ± 12.85bps |
| 4 hr | 1,137 | +18.72 ± 15.11bps |
A clean, growing, statistically significant effect across four horizons is exactly the shape a real edge should have. It is also exactly the shape overlapping samples produce.
Rebuilding a full backtest around that entry, same z and fast-tape conditions, a 4-hour max hold, a 50bps stop with a trailing exit activating at 30bps and giving back 20bps, turned the question into a non-overlapping one: one trade per independent signal, instead of one data point per qualifying minute.
| Version | n | gross | net (after ~10bps round-trip cost) |
|---|---|---|---|
| Inflated (overlapping samples, bucketed check) | 1,275 | +16.29 ± 9.53bps @1hr | — |
| Corrected (non-overlapping, full backtest) | 796 | -1.33bps | -11.33bps |
Six of the 8 symbols came back negative. The first number was inflated because every one-minute bar where price stayed extreme during the same continuing move had counted as its own separate “win” in the bucketed check. A single multi-hour overshoot was getting counted dozens of times.
Before trusting a flat result, I checked whether long and short trades were even implemented symmetrically. They were: 387 long entries and 409 short entries, close to balanced, with similarly weak, negative performance on both sides. A sign error in the direction logic tends to show one side losing badly and the other winning. This didn’t.
With the exit settled, I isolated whether the fast-tape filter was doing any real work, by running the bare z-score rule alone, with no filter, at three thresholds:
| Threshold | n | gross | net (after 10bps cost) |
|---|---|---|---|
| z ≥ 2.0 | 6,926 | -0.71 ± 2.40bps | -10.71 ± 2.40bps |
| z ≥ 2.5 | 1,303 | +6.88 ± 13.11bps | -3.12 ± 13.11bps |
| z ≥ 3.0 | 320 | +3.84 ± 44.73bps | -6.16 ± 44.73bps |
z ≥ 2.0 is the only threshold with a confidence interval tight enough to call decisive, and it is also the most negative of the three. The wider thresholds point the same direction but are individually too noisy to lean on. Removing fast tape did not produce a cleaner result anywhere, which means it was not doing meaningful work in the earlier version either.
One question was still open. A flat pooled result can hide two regimes cancelling each other out: reversion in thin-liquidity hours, the opposite in thick-liquidity hours, averaging to nothing. Checking that needed more symbols than I had finished processing for the rest of this test, so this last attempt ran on a wider 39-symbol pool instead of the original 8: 39 of 50 available symbol directories, with 8 non-crypto tickers in that dataset excluded.
| Session (UTC) | n | 60s | 300s | 600s | 1800s | 3600s | 7200s | 14400s |
|---|---|---|---|---|---|---|---|---|
| Asia (00-08) | 16,580 | +0.27±0.74 | +2.65±1.30 | +3.84±1.74 | +5.76±2.39 | +7.05±3.05 | -0.31±3.85 | +0.39±10.65 |
| EU (08-13) | 7,741 | +3.24±1.07 | +4.09±1.96 | +6.33±2.56 | +0.79±14.94 | +5.64±14.01 | +2.37±15.20 | +8.57±16.43 |
| EU-US overlap (13-16) | 8,882 | +3.28±1.05 | +3.58±1.88 | +4.53±2.51 | +0.75±3.79 | -1.70±5.32 | +0.22±6.76 | +3.19±8.58 |
| US (16-21) | 11,560 | +0.37±0.94 | +2.12±1.78 | +4.04±2.34 | -13.60±6.32 | -1.48±5.46 | +1.77±7.11 | +6.16±8.52 |
| Late US / Asia pre (21-24) | 7,101 | +0.12±2.72 | -10.12±6.18 | -12.70±8.13 | -1.71±8.29 | +7.67±8.91 | -2.82±8.96 | -6.65±11.73 |
Bold marks a confidence interval that excludes zero.
This is the nearest a real edge ever got. Asia, the thinnest-liquidity session, shows a reversion-shaped result that clears significance at the 30 and 60-minute marks, holds across 29 of 39 symbols individually (median +6.12bps, not a couple of illiquid names pulling the average), and is well powered at over 16,000 episodes. The US session also clears significance at 30 minutes, but in the momentum direction, the wrong sign for the cancellation idea this check was testing.
It still doesn’t clear the bar. The +5.76 to +7.05bps gross sits inside the realistic 4-10bps round-trip cost band for a crypto perp, with no margin left for slippage or a worse fill. It also doesn’t hold up as a regime: by 2 hours it’s still positive, but by 4 hours the same Asia bucket flips to -0.31 ± 3.85bps. A real, structural reversion effect should keep holding or grow as the window extends. This one flickers.
The Honest Verdict
This is a well-powered negative result, not an inconclusive one. The decisive test, the bare z ≥ 2.0 rule, n=6,926, gives a tight enough confidence interval to say plainly: at realistic transaction costs, extreme deviation from the EWMA VWAP does not predict a tradeable snap-back, on these 8 symbols, over this year, after any of the eight ways I tried to make it work.
One limitation applies to every number above: this is a price-only backtest. Entries and exits use the trade price the simulator recorded at that moment, with a flat 10bps round-trip cost subtracted as a stand-in for fees and slippage combined. There’s no order-book depth model, no per-exchange fee schedule, and no separate slippage simulation. Real execution could come in worse than this in thin, extreme-z conditions, where slippage tends to be largest, or better with consistent maker-rebate fills.
Three things could change the conclusion. A meaningfully lower cost basis than the 10bps assumed here, achievable mainly through consistent maker-rebate execution. Testing the roughly 45 symbols not yet covered, in case a different liquidity or volatility regime behaves differently than these 8 large, liquid names. Or combining the z-score with a second, orthogonal condition instead of trading it alone.
None of that erases what this thread already produced. The EWMA VWAP Z-Score is now a permanent, correctly-calibrated field in the live anomaly pipeline, regardless of this verdict. The simulator’s output is roughly 2,000x smaller per month than it was before this thread started, which makes the next idea dramatically faster to test. And the sequence used here, model-free check first, then excursion profiling, then a non-overlapping backtest, then a directionality check, then isolating each filter, is a repeatable way to find out whether an edge is real before trusting it with money.
If you want to track this same setup yourself, AnomIQ’s scanner runs the same metrics in real time. If you need historical data for your own research instead, email support@anomiq.io and I’ll see what I can pull.
Related Reading
- What Predicts a Big Crypto Move? 16,726 Extreme-Volume Events Tested
- I Thought I Found a Short Squeeze Pattern. Then I Tested 39 Symbols.
- Relative vs Absolute Signals: Why Fixed Thresholds Fail Crypto Scanners
FAQ
Does price deviation from VWAP predict mean reversion in crypto?
Not on its own, and not tradeably. Testing extreme deviation from a volume-clock EWMA VWAP across 8 crypto symbols and a full year of 1-minute data found forward returns that were flat to negative after realistic transaction costs, across every threshold and exit style tested.
What is EWMA VWAP and how is it different from session VWAP?
A session VWAP resets at UTC midnight and weights every trade since then equally. An EWMA VWAP decays smoothly as volume accumulates and never resets, which avoids the calibration problem a midnight reset introduces into any z-score built on top of it.
Why did a +16bps backtest result turn out to be fake?
It was inflated by overlapping samples. A model-free bucketed check treated every one-minute bar where price stayed extremely deviated as a separate winning event, so one multi-hour overshoot got counted dozens of times. Rebuilding the test with one trade per independent signal brought the same setup down to roughly flat before costs, and clearly negative after them.
Is there a time of day when mean reversion works better in crypto?
The closest thing to a real effect showed up in the Asia session, 00:00 to 08:00 UTC, where a reversion-shaped result held across 29 of 39 symbols and cleared statistical significance at the 30 and 60-minute marks. It still sits inside the realistic cost band with no margin left over, and it does not hold up past two hours, so it is a near miss, not a tradeable pattern.