
I Thought I Found a Short Squeeze Pattern. Then I Tested 39 Symbols.

What Is a Short Squeeze
A short squeeze happens when short sellers (traders betting a price will fall) must buy back their position as price rises against them. That forced buying adds more upward pressure, which squeezes the next layer of shorts and compounds into a sharp move. The mechanism needs three things at once: short sellers under pressure (open interest contracting while price climbs), a thin order book (price moving a lot per unit of volume traded), and order flow that stays directional long enough to keep the pressure building.
Early Signs of a Potential Short Squeeze: RAVE-USDT Case Study shows the mechanism in RAVE-USDT, which moved from $0.247 to $28.00 over eleven days. The single largest Buy Volume Z-Score reading in the three-day sample, +28.77 on April 8, was not the signal. Sell Volume Z-Score hit +59.63 in the same five-minute window. Both sides were active at once, a “fight” rather than a win for either side, and that moment preceded almost no sustained move. I could read the setup three days later after adding Buy Volume Concentration and contracting Open Interest to the order-flow read.
That left a testable question. I’d seen the same dual-spike “fight” pattern (buy and sell volume both hitting extreme z-scores at the same time) play out a handful of times on another coin’s chart. In isolation, it looked like a contested level about to resolve into a breakout. The RAVE-USDT case study had shown one instance of that reading failing on one symbol over three days. I tested the condition across a full year of data and 39 symbols.
I was not trying to trade the fight pattern. I wanted to know whether I had found a repeatable pattern or one coincidence I had decided to name. A trader checking by hand can stop at the chart. I had the data, so I checked.
The pattern did not survive the test. The failure showed where the original chart read misled me.
What We Tested: The Buy/Sell Volume Z-Score “Fight”
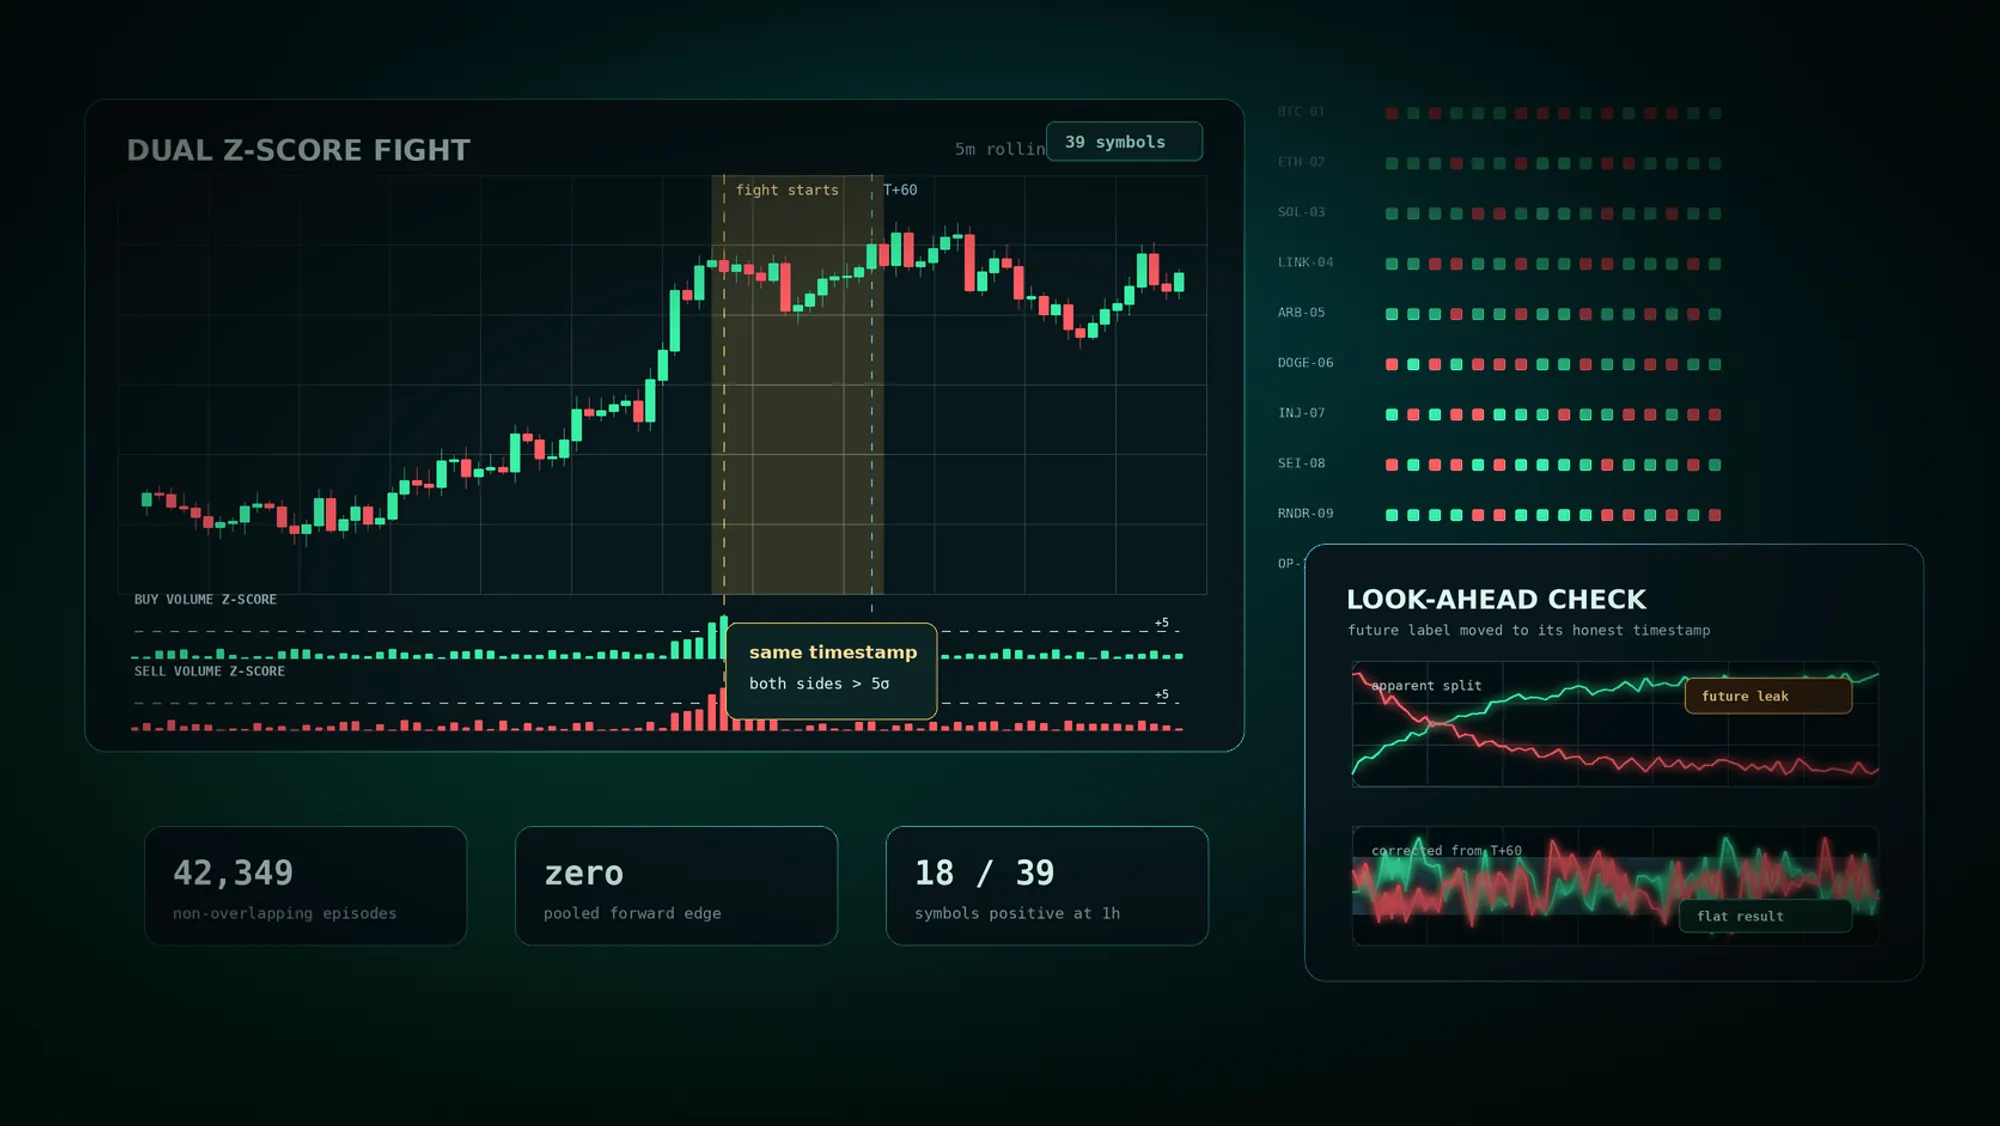
A vague chart impression is not testable, so I turned “buyers and sellers fighting” into a mechanical condition: Buy Volume Z-Score above 5 and Sell Volume Z-Score above 5 at the same time, on the 5-minute rolling window. Both sides had to show volume at least five standard deviations above their own historical baseline at the same time on the same symbol.
I ran it across 39 crypto symbols (I excluded eight tokenized-equity and commodity tickers in the dataset to keep the test limited to crypto) and the full 2025 calendar year. The condition fired 42,349 times after I collapsed consecutive qualifying minutes into one event per symbol with a 90-minute cooldown, so a single ten-minute standoff did not get counted as ten separate “discoveries.” The top 3 symbols accounted for 11.2% of episodes, and the busiest five days accounted for 2.2%. I was not looking at one coin’s anomaly or one news event in disguise.
The bulk research dataset gave me volume z-scores, taker imbalance, volatility, and price impact, but not open interest or trade-concentration data (the open interest field was empty for each symbol, the whole year). In Early Signs of a Potential Short Squeeze on RAVE-USDT, I needed those two fields to separate the real setup from the noise. I did not test that combination here. I tested a narrower question: does the order-flow z-score condition generalize on its own, without concentration or open interest.
I later reused the same event-labeling approach for a larger study of what predicts big crypto moves after extreme volume events, where direction again proved much harder to forecast than move size.
Missing open interest would matter if the fight condition showed a forward-return signal worth refining. At that point, OI would be the next layer to add, the way it was in the RAVE-USDT case study. The fight condition did not reach that step. I found flat pooled returns, and the one apparent edge collapses once I correct for look-ahead bias. There is no signal for OI to filter or confirm. The missing field limits the test scope to the order-flow condition by itself.
The First Result: Flat Returns
Entering the moment the fight starts, with no view on direction, produced forward returns indistinguishable from zero:
| Horizon | n | mean return | median | win rate |
|---|---|---|---|---|
| 1h | 42,342 | +0.28bps ± 1.58 | +0.00bps | 49.6% |
| 5h | 42,316 | +1.87bps ± 3.22 | -1.29bps | 49.5% |
| 12h | 42,255 | +0.74bps ± 4.94 | -7.67bps | 48.8% |
| 24h | 42,184 | +1.42bps ± 6.97 | -20.44bps | 47.8% |
Each confidence interval includes zero. The fight condition, on its own, added no directional information. One detail stands out: the median moves lower with horizon while the mean stays near zero, which points to a right-skewed distribution. A few large winners (squeezes, matching the original anecdote) offset more frequent small losers.
I expected the flat pooled result. A coin flip does not help a trader. The useful question came from the original chart observation: after one side wins the fight, does that resolution carry forward into the next move?
The Edge That Wasn’t
I split the same 42,349 episodes by which side controlled net taker order flow 60 minutes after the fight began, then measured returns from the fight’s start:
| Group | n (% of episodes) | 1h | 5h | 12h | 24h |
|---|---|---|---|---|---|
| buy_won | 16,531 (39.0%) | +14.46 ± 2.44 | +16.32 ± 4.78 | +15.89 ± 7.41 | +18.75 ± 11.38 |
| sell_won | 18,426 (43.5%) | -15.07 ± 2.16 | -13.28 ± 4.66 | -15.65 ± 7.27 | -19.97 ± 9.81 |
| neutral | 7,385 (17.4%) | +6.81 ± 4.78 | +7.31 ± 9.50 | +7.74 ± 14.02 | +16.01 ± 18.60 |
Each confidence interval here excludes zero, at each horizon, for both directional groups. By the standard I’d applied to other tests in this dataset, the table looked tradable. It was biased.
I’d used information from 60 minutes after the fight started (which side won) to sort episodes into two buckets, then measured returns starting from the fight’s beginning, before that information existed. In many sell_won episodes, price has moved down somewhere in those 60 minutes, because that price move helps define “sellers winning.” Bucketing episodes by a future outcome and then measuring the return that produced that outcome is not a forecast. It measures the label.
I fixed the test by measuring forward returns from the point where the trading information became available, T+60min, the earliest moment a trader could know which side won. Same episodes, same split, returns measured from the confirmation point forward instead of from the fight’s start:
| Side | Horizon | n | mean return | win rate |
|---|---|---|---|---|
| buy_won | 1h | 16,530 | -1.16bps ± 2.88 | 48.1% |
| buy_won | 5h | 16,516 | +1.30bps ± 4.79 | 49.4% |
| buy_won | 12h | 16,494 | +3.92bps ± 7.40 | 49.1% |
| buy_won | 24h | 16,463 | +1.89bps ± 11.35 | 47.9% |
| sell_won | 1h | 18,425 | -1.93bps ± 2.20 | 50.2% |
| sell_won | 5h | 18,417 | -2.45bps ± 5.05 | 50.6% |
| sell_won | 12h | 18,386 | +1.05bps ± 7.25 | 51.1% |
| sell_won | 24h | 18,357 | +5.39bps ± 10.00 | 52.3% |
Each confidence interval now includes zero, at each horizon, for both directional groups. Win rates sit at 48.1-52.3%, indistinguishable from a coin flip. Per-symbol consistency at the 1-hour mark came out to 18 of 39 symbols positive for both groups (46% either way, also a coin flip). The entire 14 to 20bps move from the first table had occurred during the 60 minutes it took to become knowable. The split had no remaining forward return to capture.
What the Failed Test Shows
The result matches two earlier posts on this blog. In Absorption vs Exhaustion in Order Flow, I called three live events by combining Volume Z-Score, Net Taker Imbalance staying near zero, Relative Price Impact, and sequencing across 5-minute, 15-minute, and 60-minute windows. In Early Signs of a Potential Short Squeeze, the RAVE-USDT case study ran into the same pattern and rejected it: on April 8 at 09:51, Buy Volume Z-Score hit +28.77 while Sell Volume Z-Score hit +59.63 at the same time, a dual-extreme “fight.” I concluded that “the largest buy z-score was not buyer control.” I could read the real setup three days later once Buy Volume Concentration and Open Interest entered the picture, and this dataset did not have those fields.
The two posts answer different questions. The case study shows direction can become readable once you add concentration, open interest, and sequence, by hand, on one instrument at a time. Here, I asked whether the order-flow z-score condition alone holds up as a mechanical rule across the whole market. It does not, which matches the case study’s conclusion that a single threshold “would have overfired” and “would have triggered… some triggers were useful, others were noise.”
Order flow can still be readable. The two case studies above show real instances where concentration, price impact, and open interest gave the read enough structure. A single chart observation, however clean it looks, is one data point. A two-number mechanical rule is not the same thing as the multi-factor read that worked in those case studies. You separate an anecdote from an edge by testing it against the size and breadth of the market it claims to describe, with non-overlapping samples, confidence intervals, and look-ahead checks.
Use a larger dataset before you name a coincidence. Check, in an afternoon and at no real risk, whether the edge you think you found is real and which extra structure is doing the work when it is: concentration, open interest, or multi-timeframe sequencing. Find out before a position is open.
Build a scanner on AnomIQ and check your own patterns against the full market before you trade them.
Related Reading
- What Predicts a Big Crypto Move? 16,726 Extreme-Volume Events Tested
- Early Signs of a Potential Short Squeeze: RAVE-USDT Case Study
- Price Up, Open Interest Down: Short Covering or Profit Taking?
- Absorption vs Exhaustion in Order Flow: 3 Crypto Examples
FAQ
Does a buy/sell volume z-score spike predict a short squeeze?
On its own, no. Testing simultaneous extreme Buy Volume Z-Score and Sell Volume Z-Score across 39 crypto symbols and a full year of 1-minute data found flat forward returns. The apparent edge came from splitting episodes with a later outcome, which introduced look-ahead bias.
What is look-ahead bias in a trading backtest?
Look-ahead bias happens when a backtest’s apparent edge depends on information that would not have existed at the time of entry. In this test, I split trade episodes by which side of the order flow “won” 60 minutes later, then measured returns from the start of the episode. That measured the move that defined the split.
Why did a real-looking edge disappear after correcting for look-ahead bias?
The original split used information from 60 minutes in the future to sort historical episodes. Measuring returns from the confirmation point removed the apparent separation, with confidence intervals including zero at each tested horizon.