How to Detect Crypto Volume Anomalies in Real Time (Binance USDT + Coinbase USD)
Most crypto scanners still treat anomalies as fixed thresholds.
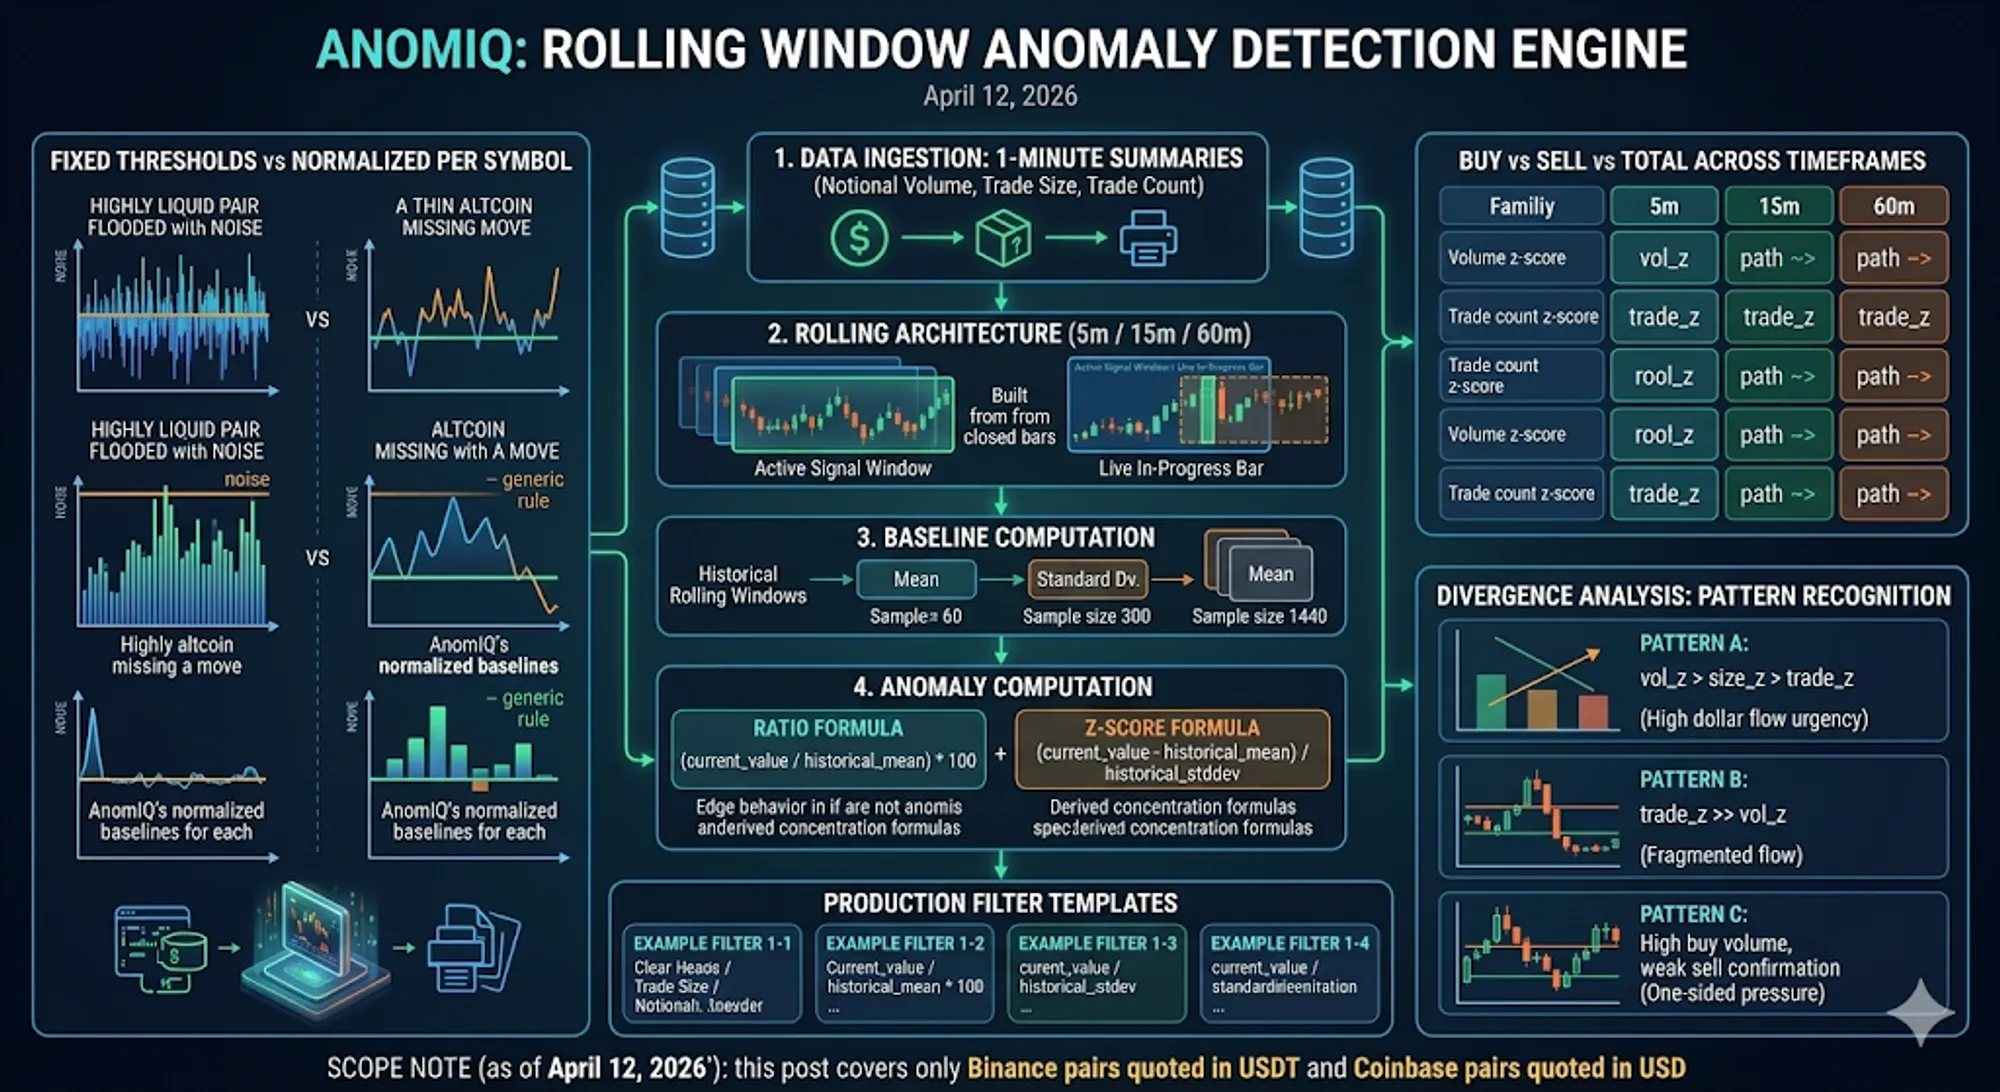
That works until you scan a high-liquidity pair and a thin altcoin with the same rule. One floods you with noise, the other misses the move you actually care about.
Volume anomaly detection works at scale only when each symbol is measured against its own baseline. In AnomIQ, we recompute that baseline on rolling 5m, 15m, and 60m anomaly windows.
Scope note (as of April 12, 2026): this post covers only Binance pairs quoted in USDT and Coinbase pairs quoted in USD.
For the broader search-friendly explanation of the method, start withZ-Score Volume Anomaly Detection in Trading. This article is the production implementation companion.
You can use this implementation and these filters to separate signal from churn.
If you want the order-flow layer that sits on top of these volume anomalies, read Crypto Order Flow Trading: Taker Flow and Scanner Rules. It shows how volume z-score, taker imbalance, Relative Price Impact, liquidity and open interest combine into scanner rules.
The Three Inputs: Notional Volume, Trade Size, Trade Count
Everything starts from 1-minute trade summaries. The anomaly engine rolls those forward in real time.
| Input | Main scanner metrics | What it captures |
|---|---|---|
| Notional volume | Total Volume Z-Score, Buy Volume Z-Score, Sell Volume Z-Score | Dollar flow (USD notional) |
| Trade size | Total Trade Size Z-Score, Buy Trade Size Z-Score, Sell Trade Size Z-Score | Base-asset quantity traded |
| Trade count | Total Trade Count Z-Score, Buy Trade Count Z-Score, Sell Trade Count Z-Score | Number of executions |
Important distinction:
volumeanswers: how much dollar value tradedsizeanswers: how much base quantity tradedcountanswers: how many prints occurred
Two symbols can print a similar volume anomaly for opposite reasons: a few large prints or many small prints.
Rolling Architecture (5m / 15m / 60m)
The engine keeps a rolling buffer of 1-minute bars and builds higher windows from that stream. It does not wait for fixed candle closes.
- Ingest 1-minute trade summaries for each symbol.
- Keep rolling aggregates for 5m, 15m, and 60m.
- Build current window metrics as closed bars plus the live in-progress bar.
- Build baselines from historical rolling windows (excluding the active signal window).
- Compute ratios, z-scores, and derived fields independently for each timeframe.
Baseline sample counts in production are:
- 5m uses
60historical 5m rolling windows. - 15m uses
300historical 15m rolling windows. - 60m uses
1440historical 60m rolling windows.
Exact Formulas
Ratio
ratio = (current_value / historical_mean) * 100Used for:
- Total Volume Ratio, Buy Volume Ratio, Sell Volume Ratio
- Total Trade Size Ratio, Buy Trade Size Ratio, Sell Trade Size Ratio
- Total Trade Count Ratio, Buy Trade Count Ratio, Sell Trade Count Ratio
Z-Score
z = (current_value - historical_mean) / historical_stddevUsed for:
- Total Volume Z-Score, Buy Volume Z-Score, Sell Volume Z-Score
- Total Trade Count Z-Score, Buy Trade Count Z-Score, Sell Trade Count Z-Score
- Total Trade Size Z-Score, Buy Trade Size Z-Score, Sell Trade Size Z-Score
Edge behavior in code:
- if historical stddev is
0and current value is above mean, z is forced to10.0 - otherwise it returns
0
Net Taker Imbalance
Net Taker Imbalance = ((Buy Volume - Sell Volume) / Total Volume) * 100Derived concentration and intensity
Buy Volume Concentration = Buy Volume Z-Score - Buy Trade Count Z-Score
Sell Volume Concentration = Sell Volume Z-Score - Sell Trade Count Z-Score
Intensity Z-Score = Total Volume Z-Score - Total Trade Count Z-Score
These deltas show whether the anomaly comes from larger prints, more prints, or both.
Buy vs Sell vs Total Across Timeframes
Each timeframe exposes the same field families, so filter logic is portable:
| Family | Total | Buy | Sell |
|---|---|---|---|
| Volume z-score | Total Volume Z-Score | Buy Volume Z-Score | Sell Volume Z-Score |
| Trade count z-score | Total Trade Count Z-Score | Buy Trade Count Z-Score | Sell Trade Count Z-Score |
| Trade size z-score | Total Trade Size Z-Score | Buy Trade Size Z-Score | Sell Trade Size Z-Score |
| Volume ratio (%) | Total Volume Ratio | Buy Volume Ratio | Sell Volume Ratio |
| Trade count ratio (%) | Total Trade Count Ratio | Buy Trade Count Ratio | Sell Trade Count Ratio |
| Trade size ratio (%) | Total Trade Size Ratio | Buy Trade Size Ratio | Sell Trade Size Ratio |
Timeframe examples:
- Buy Volume Z-Score (5m)
- Sell Trade Count Z-Score (15m)
- Total Trade Size Z-Score (60m)
How to Read Volume vs Size vs Count Divergence
Most false positives come from ignoring divergence between volume, size, and trade count.
Pattern A: Total Volume Z-Score > Total Trade Size Z-Score > Total Trade Count Z-Score
Interpretation:
- Dollar flow is rising faster than base quantity and faster than execution count.
- Notional urgency rises faster than print frequency.
Filter example:
Total Volume Z-Score (5m) > 3.0
AND Total Volume Z-Score (5m) > Total Trade Size Z-Score (5m)
AND Total Trade Size Z-Score (5m) > Total Trade Count Z-Score (5m)
Pattern B: Total Trade Count Z-Score >> Total Volume Z-Score
Interpretation:
- Many executions, but not proportional dollar flow.
- Typical of fragmented, lower-conviction flow.
Filter example:
Total Trade Count Z-Score (5m) > 3.0
AND Total Volume Z-Score (5m) < 1.5
Pattern C: High buy volume with weak sell confirmation
Interpretation:
- Buy-side pressure is anomalous while sell-side participation is not.
Filter example:
Buy Volume Z-Score (5m) > 2.5
AND Sell Volume Z-Score (5m) < 1.0
AND Net Taker Imbalance (5m) > 20
Production Filter Templates
1) Buy-side anomaly with cross-timeframe confirmation
Today Volume in $ > 500000
AND Buy Volume Z-Score (5m) > 2.5
AND Buy Volume Z-Score (15m) > 1.5
AND Net Taker Imbalance (5m) > 20
2) Notional outruns size (your requested case)
Today Volume in $ > 500000
AND Total Volume Z-Score (5m) > 2.5
AND Total Volume Z-Score (5m) > Total Trade Size Z-Score (5m)
AND Buy Volume Z-Score (5m) > Buy Trade Size Z-Score (5m)
3) Large-print buy concentration
Today Volume in $ > 500000
AND Buy Volume Z-Score (5m) > 2.5
AND Buy Volume Concentration (5m) > 1.5
AND Net Taker Imbalance (5m) > 20
4) Sell-side liquidation pressure
Today Volume in $ > 500000
AND Sell Volume Z-Score (5m) > 2.5
AND Sell Volume Z-Score (15m) > 1.5
AND Net Taker Imbalance (5m) < -20
Practical Notes Before You Deploy Filters
- Start with a liquidity floor such as Today Volume in $. Without it, thin books will pollute your feed.
- Use 5m for detection, 15m for confirmation, 60m for regime context.
- Treat one-bar spikes as weak evidence. Persistence across updates is what matters.
- Pair Net Taker Imbalance with z-score metrics. One tells direction, the other tells rarity.
- Tune by market behavior, not by a single coin that looked good in one replay.
FAQ
Which pairs are included in this analysis?
As of April 12, 2026, this article refers only to:
- Binance pairs quoted in
USDT - Coinbase pairs quoted in
USD
What does Today Volume in $ mean?
Today Volume in $ is total traded dollar notional since 00:00 UTC for the current day. It is a top-level liquidity gate, not a directional signal.
Is trade size the same as notional volume?
No. In this engine:
volumeis USD notional (qty * price)sizeis base quantity
Those fields diverge during sharp repricing.
Why compute the same metrics on 5m, 15m, and 60m?
Use all three windows to rank conviction. A 5m spike without 15m support often fades.
What does Buy Volume Concentration tell me?
It is Buy Volume Z-Score minus Buy Trade Count Z-Score. High values mean buy-side volume is concentrated in fewer, larger executions rather than many small prints.
Is this fixed-threshold scanning?
No. The engine normalizes each symbol on each timeframe, so one rule can scan liquid majors and thinner pairs.
For baseline-relative logic, see What Is a Z-Score in Crypto Trading and Why Relative Signals Beat Fixed Thresholds. For directional flow context, see Net Taker Imbalance: What It Measures and Why Order Flow Traders Use It and the broader Crypto Order Flow Trading framework.