
Z-Score in Trading: Meaning, Formula, and Thresholds

On a trading desk, a raw number is only useful after you know what is normal for that market. The same value can be routine on BTC, unusual on a smaller perpetual, and meaningless on an illiquid pair.
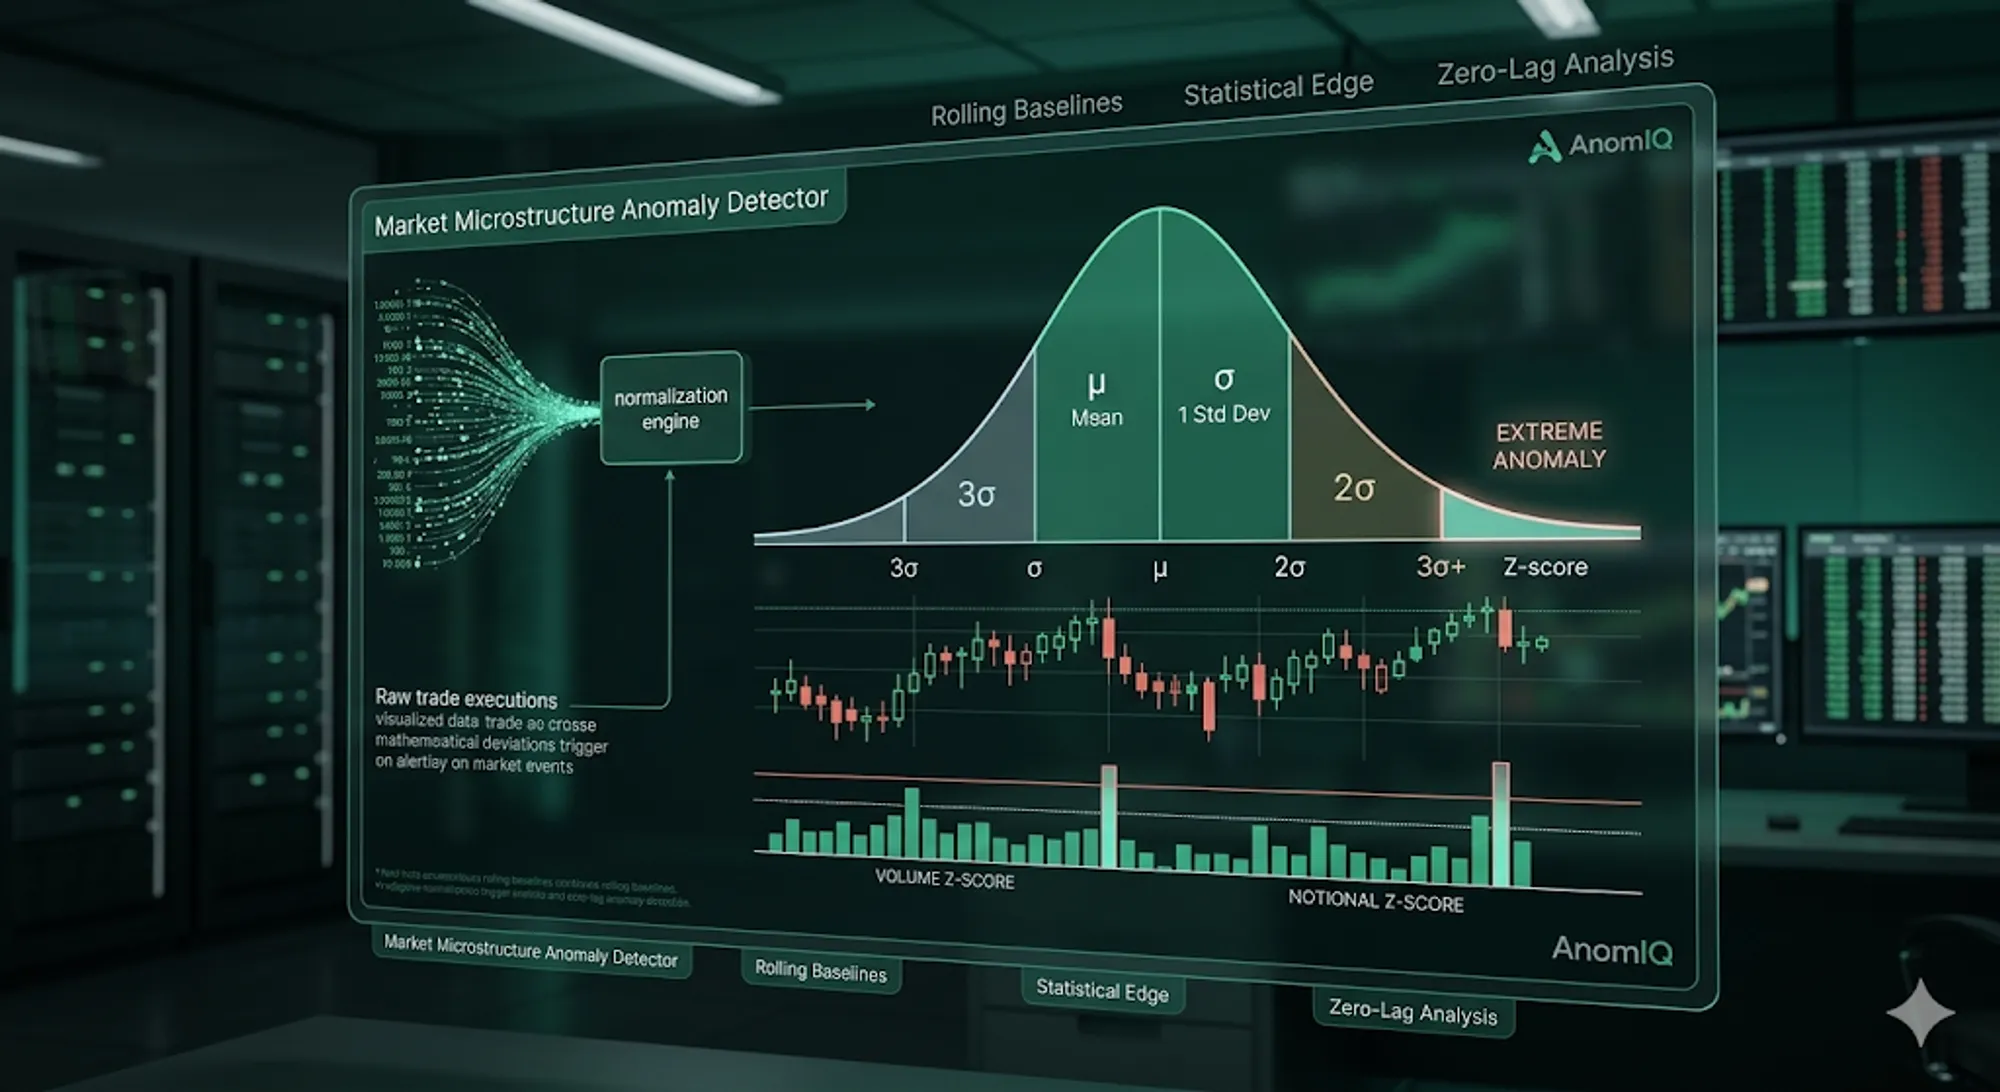
A z-score in trading measures that difference. It shows how far a current value sits from its recent historical baseline, expressed in standard deviations.
The trader’s question is simple:
Is this market doing something unusual compared with its own recent history?
That is why z-scores work well in live scanners. They turn noisy tape data into relative readings, so you can compare different symbols and metrics without pretending one raw threshold fits every market.
This article covers the general meaning, formula, thresholds, and scanner use cases. For volume-specific rules, use the dedicatedvolume z-score trading guide.
What Is a Z-Score in Trading?
In statistics, a Z-score (or standard score) measures how far a specific data point deviates from the historical average, expressed in standard deviations.
The math is calculated as: Z = (Current Value - Mean) / Standard Deviation
Where:
- Current Value: The latest real-time measurement, such as return, volume, spread, volatility, or trade count
- Mean: The historical average of that specific metric
- Standard Deviation: The measure of how much the metric normally varies (volatility)
For trading applications, the interpretation is straightforward:
| Z-Score | Statistical Meaning | Market Interpretation |
|---|---|---|
| 0 to 1 | Average | Normal background noise. |
| 1.0 to 2.0 | Elevated | Above normal, but common in active markets. |
| 2.0 to 3.0 | Unusual | Far enough from baseline to inspect the surrounding context. |
| > 3.0 | Extreme deviation | Rare for that metric and instrument; useful only with confirmation. |
A Z-score of 3.0 or higher means the reading is far from the recent baseline. In market analysis, that is a reason to inspect the tape, not a standalone long or short signal.
Why Z-Score Beats Fixed Thresholds
Raw thresholds are mathematically blind.
For example, a single fixed threshold can mean different things across volume, trade count, open interest, volatility, or spread data. The number may look large, but that does not tell you whether it is unusual for the instrument you are watching.
Z-score solves this problem by normalizing activity relative to the instrument’s own historical behavior.
Instead of asking, “Is this number large?” you are asking, “Is this reading statistically abnormal for this specific asset and metric?” This dynamic normalization is what makes it possible to run a market scanner across hundreds of instruments simultaneously without getting drowned in false positives.
Common Trading Metrics That Use Z-Scores
A useful scanner applies z-score normalization across several market metrics. Each metric answers a different question, so the number only makes sense when you know what was normalized.
1. Participation and volume metrics
These measure whether traded activity is unusual relative to historical baselines. The detailed workflow belongs in the volume z-score trading guide.
- Z-Score > 3.0: Indicates a rare participation surge. These deviations often coincide with repricing, news, or sudden execution flow.
See it in action: You can visualize these exact statistical deviations minute-by-minute using the Volume Anomaly Histograms in our new Deep Dive 2.0 dashboard.
If you want to inspect the same idea on a chart before building a scanner rule, use the free TradingView Volume Anomaly Indicator.
2. Notional Volume Z-Score
Measures the absolute dollar value (capital flow) of trades executed, filtering out low-value retail noise.
- If Notional Z-score is high (e.g., 3.2) but the raw Trade Count Z-score is low (e.g., 0.9), more notional is moving through fewer transactions. That points to larger average execution size rather than simple trade-count noise.
3. Directional Z-Score (Buy vs. Sell Volume)
Directional Z-scores separate aggressive taker-buys from taker-sells, providing insight into which side of the market is dominating the tape.
- If Buy Volume Z-Score is
3.5and Sell Volume Z-score is0.4, the anomaly is heavily skewed toward buyers. Tracking this directional asymmetry helps analysts identify aggressive accumulation or distribution phases as they develop in the tape.
Why Rolling Baselines Matter
Z-scores are only as accurate as the mean ($\mu$) they are measured against.
Static baselines, like a fixed daily average, become stale as intraday volatility shifts. A scanner that needs current context uses continuous rolling statistical windows.
This means the mean and standard deviation update as new data arrives, giving two practical advantages:
- Adaptive Normalization: The baseline instantly adjusts to changing market volatility regimes. If you want to know the engineering challenges behind calculating this math without server lag, read our breakdown on why perfect math broke our real-time scanner.
- Faster Detection: Anomalies can surface during the active window instead of waiting for a fixed candle to close.
Modern quantitative scanners compute these rolling baselines across multiple timeframes, such as 5m, 15m, and 60m, to separate short-lived spikes from more persistent changes.
If you want the exact production implementation (including how volume, trade count, and trade size are computed side by side across 5m/15m/60m), read How to Detect Crypto Volume Anomalies in Real Time (Binance USDT + Coinbase USD).
Automate Your Statistical Anomaly Detection
Statistical anomaly detection is not a trading strategy on its own, but it is the foundational framework for discovering the exact moments where market behavior deviates from the norm. Those deviations are the starting point for structural analysis.
Calculating rolling standard deviations across hundreds of assets manually is not realistic.
AnomIQ automates this math. The engine ingests raw tick data and applies continuous z-score normalization across volume, trade count, and notional flow. You can translate those metrics into alerts with pre-built scanners or custom multi-timeframe filters.