
Real-Time Crypto Scanner: Live Feeds vs Anomaly Detection

Trader turned software engineer, with 4+ years building systems for crypto exchanges. Founder of AnomIQ, a real-time crypto anomaly scanner for quantitative traders.
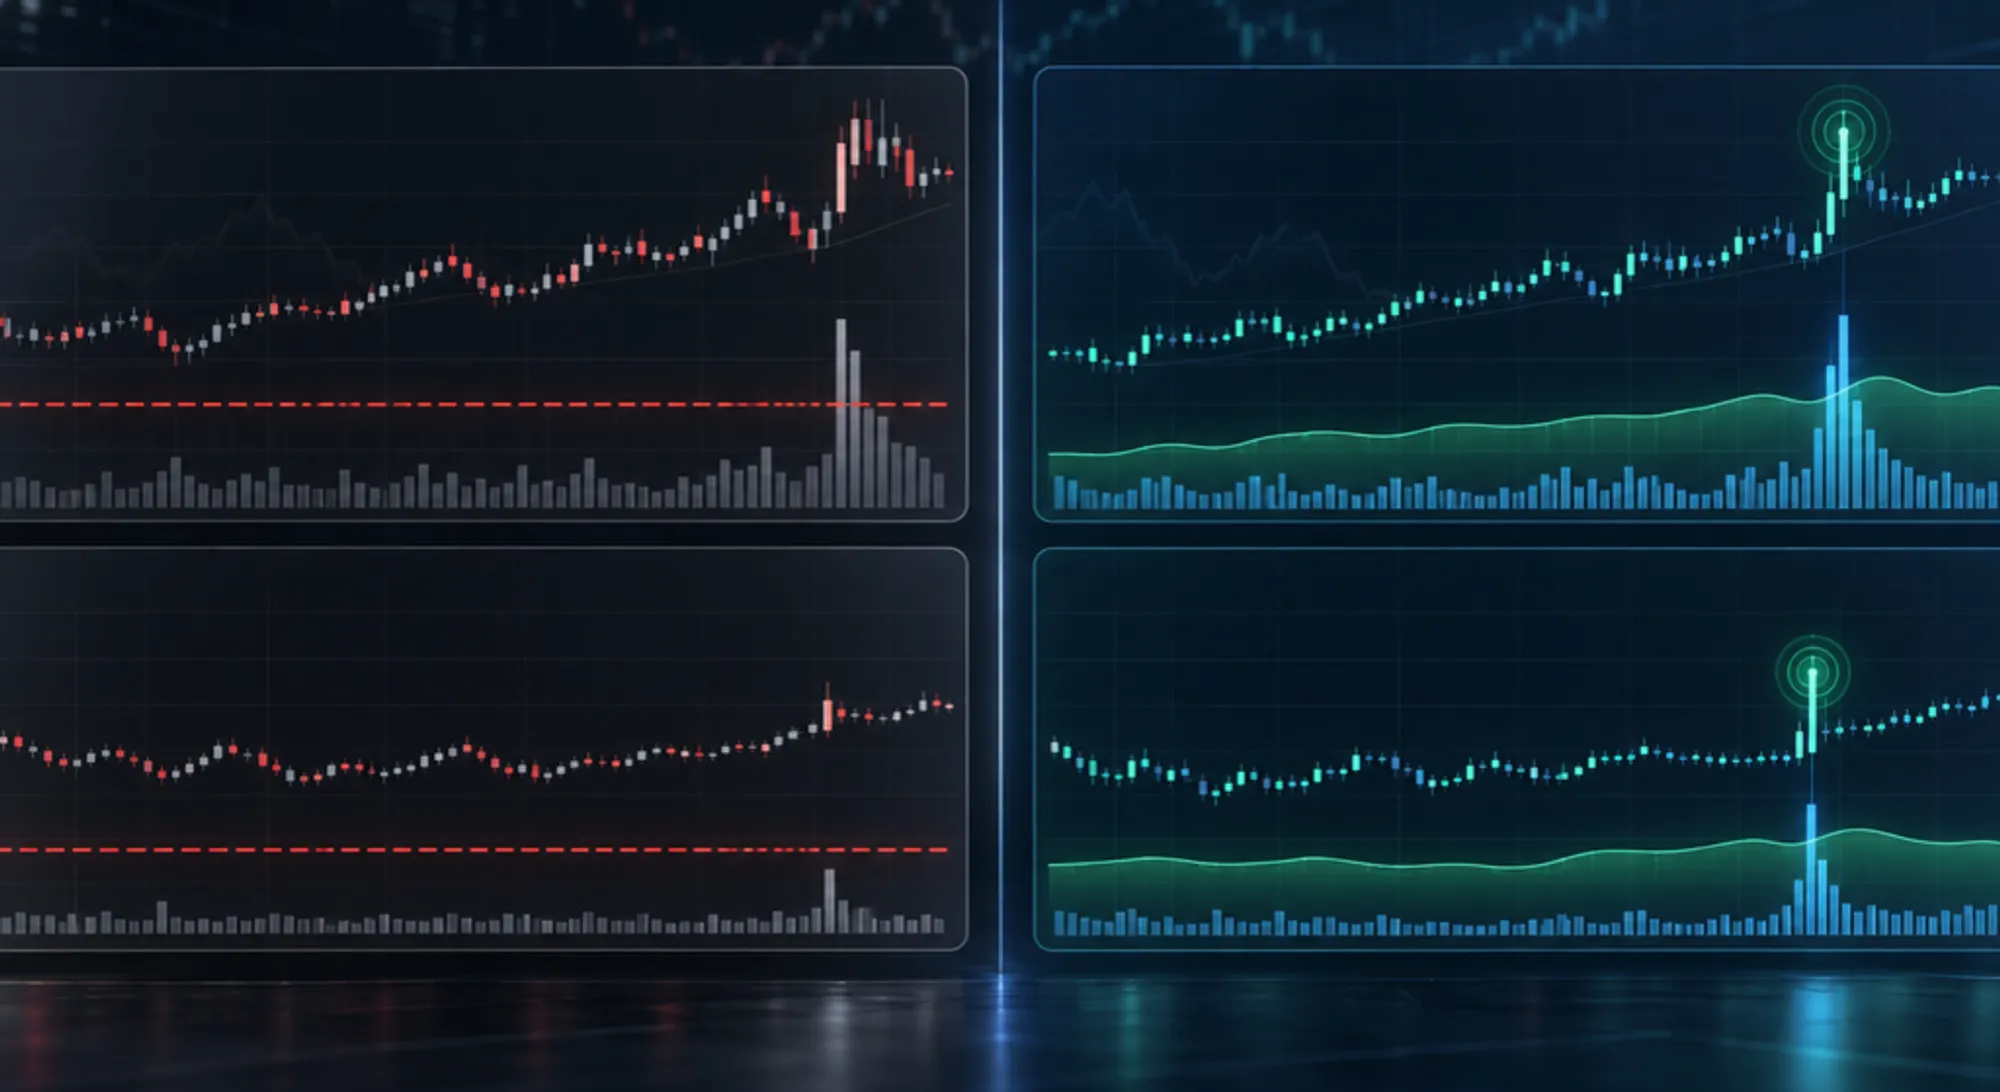
A real-time crypto scanner is software that continuously checks live trade data across many markets against a rule you set, and surfaces the coins that match right now. That sounds simple. In practice, most tools carrying that label are really just live price feeds with a search box, not anomaly detectors, and the difference matters more than it looks.
Many tools sold as real-time crypto screeners are built around one design choice: a fixed number. Volume above $X. Price change above Y%. That number has to work for both BTC and a coin trading a few hundred thousand dollars a day, and it can’t, because “unusual” means something different for each one.
This article walks through what a real-time crypto scanner actually needs to do, and why fixed-threshold screeners structurally can’t do it for the full market. Then it covers how relative, z-score-based detection solves the same problem without retuning a number per coin.
Key Takeaways
- A real-time crypto scanner needs two properties together: continuous evaluation across many markets, and a threshold that adapts per coin. Most tools only have the first one.
- A fixed volume or price threshold has to be tuned for large-cap liquidity, which means it structurally cannot also catch anomalies on thin, small-cap markets.
- Z-score detection measures deviation from a coin’s own rolling average, so the same rule scans BTC and a $5M-cap altcoin without retuning.
- “Real-time” should mean the scanner updates as trades arrive within a rolling window, not that a chart bar closed and reset a fixed alert.
- A liquidity floor (not just a z-score) is still required, because thin markets can print extreme z-scores from small absolute volume.
What Is a Real-Time Crypto Scanner?
A real-time crypto scanner is a tool that watches live trade data across a list of coins and continuously checks it against conditions you define. It alerts you the moment a market meets them. The “real-time” part means the check happens as trades arrive, not on a fixed schedule. The “scanner” part means it runs across many markets at once, instead of watching one chart.
Those two properties, continuous cross-market coverage and live evaluation, are what separate a scanner from a price tracker. A lot of tools marketed as a real-time crypto screener deliver only the live-price half.
Live Data Feed vs. Real-Time Anomaly Detection
Most tools that call themselves real-time crypto scanners are, underneath, live price and volume feeds with sorting and a search box. They tell you what’s happening right now. They don’t tell you whether what’s happening is statistically unusual for that specific coin.
That distinction is easy to miss because both experiences look similar on screen: numbers updating, a table refreshing, a list of coins. The difference is in what triggers a row to matter.
| Live-data tool | Real-time anomaly scanner | |
|---|---|---|
| What it shows | Every tracked coin, continuously | Only coins matching a statistical rule, right now |
| Who defines “unusual” | You do, by eye | The rule does, e.g. a z-score threshold |
| Update basis | Ticks or a fixed refresh | A rolling window, recalculated as trades arrive |
| Best for | Browsing the market | Cutting hundreds of markets down to the ones worth checking |
The first is a dashboard. The second is a filter with a mathematical definition of “unusual” attached to it.
The rolling-window part matters too. A chart-based alert typically evaluates once a bar closes, on a 5-minute or 15-minute cadence. A rolling-window scanner recalculates its 5m, 15m, and 60m readings continuously as trades stream in from the exchange, whether that’sBinance or Coinbase. A volume shift two minutes into a window is already visible, instead of waiting for the bar to finish.
Why Fixed Thresholds Miss Most of the Market
Fixed-threshold screening is the design most generic crypto screeners use, including altFINS, one of the category’s better-known pattern screeners. It’s a reasonable design for a small watchlist. It breaks down once the same rule has to work across an entire coin universe that spans four or five orders of magnitude in trading volume.
The mechanism is straightforward. A fixed rule like “24h volume above $2 million” has to be set high enough to filter out routine noise on liquid coins. That same number is then structurally incapable of firing on a coin whose entire normal trading range sits below it, no matter how unusual that coin’s activity becomes relative to itself. AnomIQ’s own z-scores run on 5m, 15m, and 60m rolling windows rather than a fixed daily lookback, but the underlying problem is the same regardless of window: a static number can’t flex per coin.
An illustrative example, not live data:
| Market | 24h volume | Fixed “$2M+” rule | 15m Volume Z-Score | Result |
|---|---|---|---|---|
| Large cap (e.g. BTC) | Billions | Passes, every day | 0.4 | Correctly ignored, routine day |
| Mid-cap perpetual | $6.2M | Passes | 3.1 | Correctly flagged, genuine anomaly |
| Small-cap altcoin | $340K | Never reaches the threshold | 3.4 | Missed entirely by the fixed rule |
The small-cap row is the failure mode that matters. That coin is doing 3.4 standard deviations more volume than its own normal range, a real statistical anomaly. A fixed-dollar screener will never surface it, because $340K never crosses a threshold calibrated for BTC-sized liquidity.
How Relative (Z-Score) Detection Works Instead
Relative anomaly detection asks a different question than a fixed threshold does. Instead of “is this number above X,” it asks “is this reading unusual for this coin, compared to its own recent history.”
The mechanism is a z-score:
z-score = (current value − rolling mean) / rolling standard deviation
A z-score of 0 means current activity matches the coin’s own baseline. A z-score of 2.5 means it’s meaningfully unusual for that coin specifically. A z-score of 3.0 or higher is rare. It’s the same statistic used across quantitative finance generally: how many standard deviations a value sits from a dataset’s mean. Here, that dataset is a coin’s own rolling trade data, not a fixed benchmark. Because the baseline belongs to the instrument, BTC gets compared against BTC’s own history. A small-cap altcoin gets compared against its own history too. Same rule, no manual per-coin adjustment.
That’s the structural fix to the table above. A single condition, Total Volume Z-Score (15m) > 2.5, correctly ignores BTC’s routine day. It also correctly flags both the mid-cap perpetual and the thin altcoin, because both are genuinely unusual relative to themselves.
For the full mechanics of why this beats a fixed number, see Relative vs. Absolute Signals: Why Fixed Thresholds Fail Crypto Scanners. For the volume-specific version of this math across total, buy-side, and sell-side flow, see Z-Score Volume Anomaly Detection in Crypto Trading.
One caveat worth stating plainly: a z-score alone isn’t sufficient on very thin markets, where a single order can distort the rolling window enough to produce a misleadingly extreme reading. That’s why a working scanner rule pairs a z-score condition with a Liquidity Score floor, not a z-score alone.
A z-score is also a different tool than the “relative volume” ratio some screeners offer: current volume divided by an average. A ratio treats two very different situations the same way. A doubling from a stable baseline looks identical to a doubling from a highly variable one, because the ratio ignores how much a coin’s activity normally swings. Dividing by standard deviation fixes that. It accounts for normal variability, so a 2.5 z-score reading is a stronger filter than “2x average volume” on a coin whose volume already swings 2x on an ordinary day.
Want to see this on your own filter list instead of a table? A relative rule handles all three rows above with one condition, not three. Try it on the free tier: the full terminal with 30-minute delayed data, no credit card required. Real-time data is on Pro.
Reading a Real-Time Crypto Scanner Alert
A z-score crossing a threshold is the reason to look, not a conclusion by itself. A high reading tells you a market is behaving unusually for itself right now. It doesn’t tell you which side is driving that activity or whether the move has any follow-through.
Three additional readings turn a bare anomaly flag into something worth investigating. Net Taker Imbalance shows whether the activity is one-sided or balanced: aggressive buyers dominating, aggressive sellers dominating, or neither. Relative Price Impact shows whether that volume is moving price efficiently, or getting absorbed by passive liquidity instead. Comparing the reading across 5m, 15m, and 60m windows shows whether the anomaly is one noisy minute or a persisting shift.
That’s the difference between a scanner that just flags activity and one that gives you enough context to decide whether a market is worth a closer look. AnomIQ’s Deep Dive panel surfaces all three alongside the chart the moment an alert fires, so the context is one click away rather than something you reconstruct by hand. None of this tells you which direction to trade, only that something statistically unusual is developing and where to look next.
Building Your Own Relative Real-Time Scanner
Putting this together as an actual filter looks like a small stack of conditions rather than one number:
Today Volume in $ > 500,000
AND Liquidity Score > 50
AND Total Volume Z-score (15m) > 2.5
The liquidity floor excludes markets thin enough that a single trade could distort the rolling window. The z-score condition does the actual anomaly detection, scaled to each coin’s own history. The 15m window filters out single-minute noise that a 5m-only rule would catch.
That’s a starting filter, not a finished one. Adding directional confirmation, order flow, and cross-timeframe checks is its own topic, covered in full in How to Build a Custom Crypto Scanner. For the exchange-level implementation details behind this kind of crypto volume anomaly detection, on Binance USDT and Coinbase USD specifically, see How to Detect Crypto Volume Anomalies in Real Time.
If your current workflow is closer to single-chart alerts than market-wide scanning, TradingView Alerts vs. Real-Time Market Scanners covers when that’s still the right tool and when the search space has outgrown it.
FAQ
What is a real-time crypto scanner?
A real-time crypto scanner continuously evaluates live trade data across many markets against a rule you define, and surfaces the symbols that match right now, instead of waiting for you to check each chart yourself.
How is a real-time crypto scanner different from a live price screener?
A live price screener shows current prices and volume updating in real time, but you still have to decide what counts as unusual. A real-time crypto scanner applies a statistical rule continuously and only surfaces markets that actually meet it.
Why do fixed-threshold crypto screeners miss small-cap anomalies?
A fixed threshold has to be set high enough to filter noise on large-cap coins, which means it never fires on a small-cap coin trading a fraction of that dollar volume, even during a genuine anomaly.
What is z-score anomaly detection in crypto trading?
Z-score anomaly detection measures how many standard deviations current activity sits from a coin’s own rolling average, so the same rule adapts automatically to each coin’s normal trading range.
Does a real-time scanner wait for a candle to close?
A rolling-window scanner does not. It updates its live 5m, 15m, and 60m readings as trades arrive, rather than waiting for a fixed chart bar to finish.
Can I build my own real-time crypto scanner?
Yes, using a platform that exposes rolling z-score, order flow, and liquidity metrics as filter conditions rather than fixed price alerts. See the filter breakdown above and the full rule-building guide linked in this article.
Conclusion
A real-time crypto scanner only does its job if two things are true together. It has to watch the whole market continuously, and its definition of “unusual” has to adapt to each coin instead of using one fixed number. Most tools wearing the label deliver only the first property. That’s why a small-cap coin can print a genuine anomaly and never trip a fixed-dollar rule calibrated for BTC-sized liquidity.
Z-score detection fixes that. It measures deviation from a coin’s own rolling baseline instead of a fixed threshold, so the same rule scans BTC and a $5M-cap altcoin without retuning. Pair it with a liquidity floor, since thin markets can still produce misleading readings from small absolute volume. That combination is what generalizes across the coin universe, instead of a rule tuned for a handful of large-cap charts.
Open AnomIQ and build a scanner with a volume z-score and liquidity floor across 5m, 15m, and 60m windows. The free tier gives you the full terminal with 30-minute delayed data and no credit card; real-time data is on Pro.