BTC Correlation Scanner: Find Altcoins Decoupling From Bitcoin
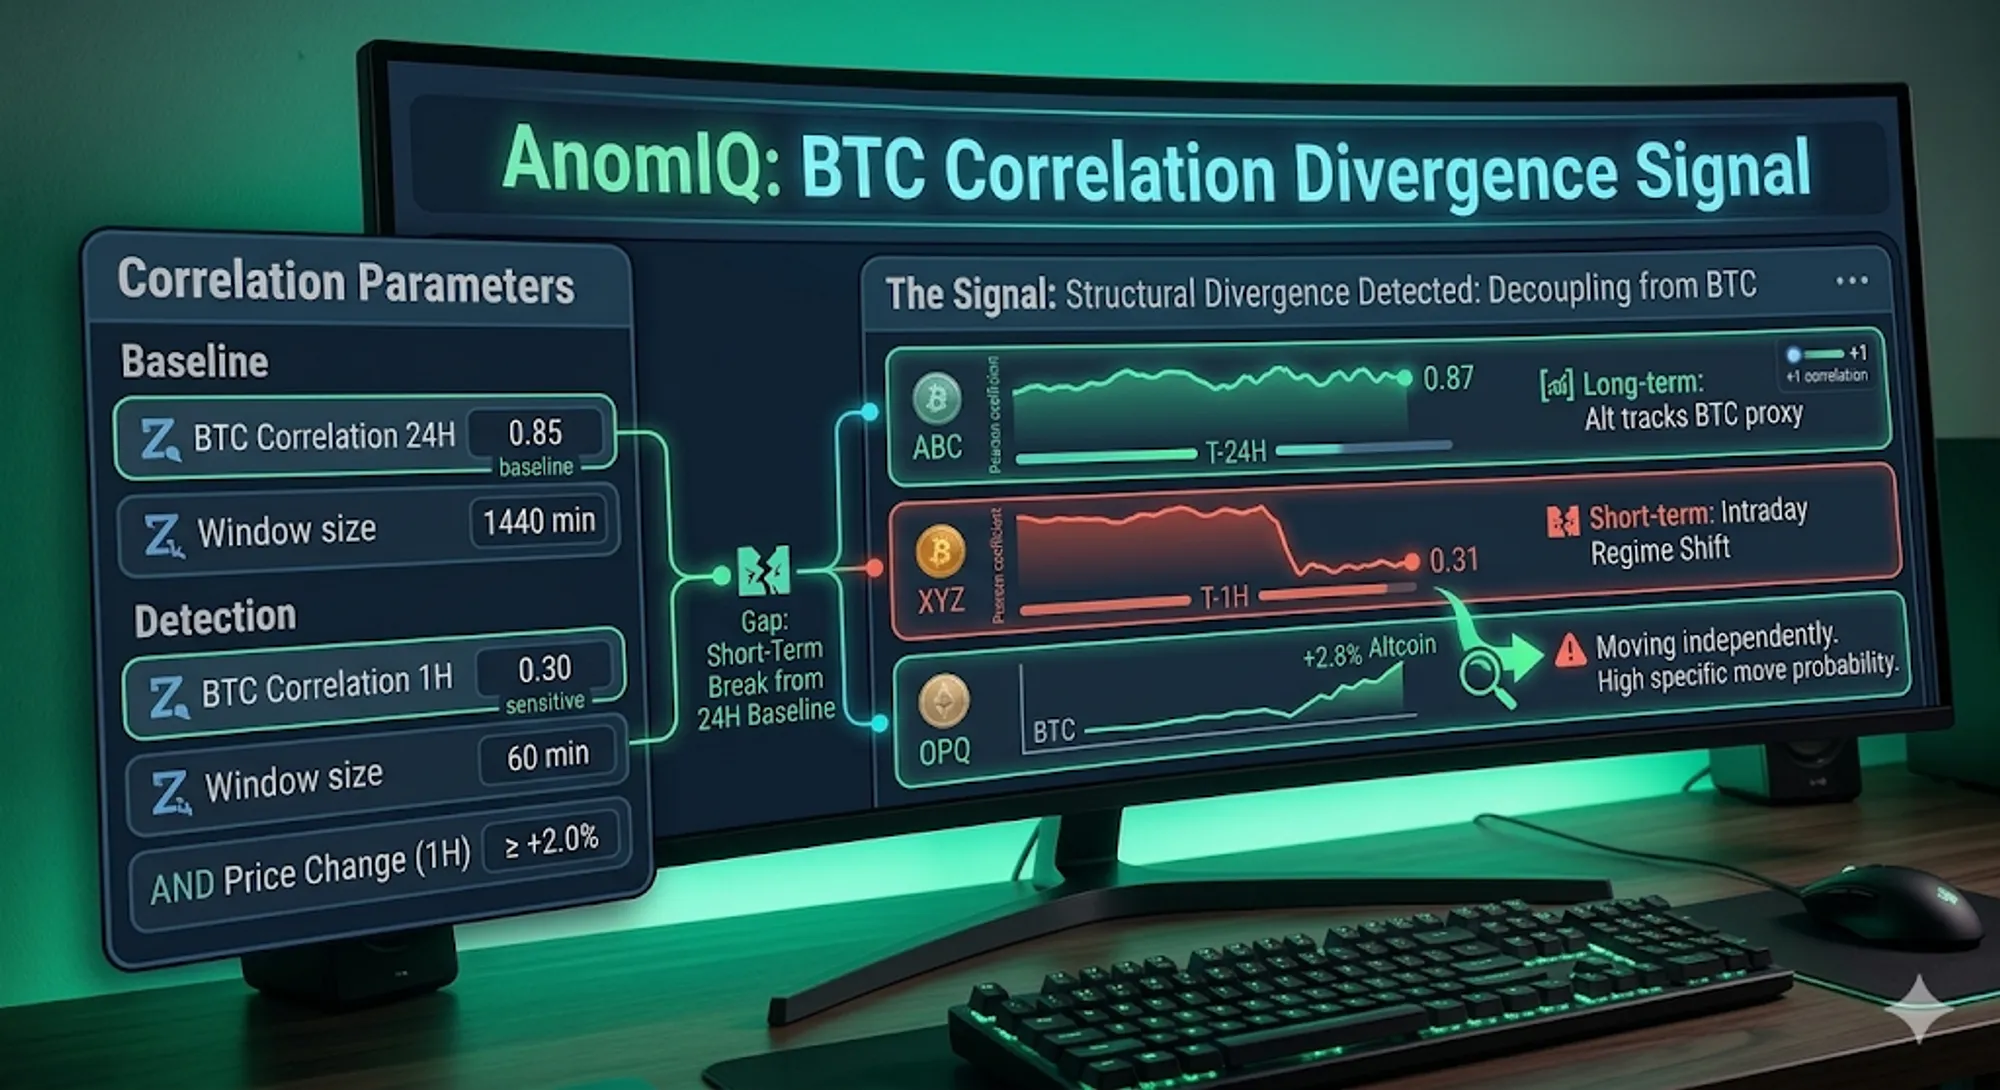
A coin has tracked Bitcoin for 24 hours with a Pearson correlation of 0.87. In the last 60 minutes, that reading drops to 0.31. Bitcoin is flat. The coin is up 2.8%.
The divergence is structural.
If the coin were expressing BTC beta, the 1-hour correlation would match the 24-hour baseline. It does not. Correlation is how you separate BTC beta from a coin-specific move. That is what BTC Correlation 1H and BTC Correlation 24H measure in the AnomIQ scanner.
Compare the live 1H and 24H readings across Binance spot, Binance perpetuals, Coinbase, or Hyperliquid. Each table updates every five minutes and sorts in your browser.
For current market tables, use the venue-specific pages:
| Live table | Best use |
|---|---|
| Binance perpetuals BTC correlation | Perpetual contracts where funding, leverage, and open interest matter. |
| Hyperliquid BTC correlation | Hyperliquid pairs when you want the same correlation read outside Binance. |
| Binance spot BTC correlation | Spot-market co-movement without perpetual-specific positioning effects. |
| Coinbase BTC correlation | USD spot markets with Coinbase-listed instruments. |
What Is Pearson Correlation?
Pearson correlation is a statistical measure of the linear relationship between two variables. It produces a coefficient ranging from −1 to +1.
- +1: the two series move in perfect lockstep. Every 1% move in BTC is matched by a proportional move in the other asset.
- 0: no linear relationship. The two assets move independently.
- −1: perfect inverse relationship. When BTC rises, the asset falls proportionally.
The scanner runs both parameters on 1-minute returns, not raw prices. Price-based correlation picks up shared long-term trend: two assets going up over the same six months look highly correlated even if their day-to-day moves are unrelated. Return-based correlation removes that. Each minute stands on its own: did the coin move with BTC, or not?
Both parameters update once per completed 1-minute bar. The 1H window uses 60 observations. The 24H window uses 1,440.
Why BTC Correlation Matters
Bitcoin drives most of the crypto market’s risk-on/risk-off behavior. Most liquid altcoins track it closely: The Block’s BTC Pearson Correlation tracker shows 30-day correlations against major assets regularly exceeding 0.70.
That creates a scanning problem.
BTC moves +2% and your altcoin moves +2.1%. Not interesting. The coin is expressing beta. But if BTC moves +0.1% and the altcoin moves +2.1%, something else is driving it. Across hundreds of assets in real time, correlation is what separates them.
Near 1.0: the coin is a BTC proxy. Near 0: it has its own driver.
The Two Windows: What Each One Tells You
BTC Correlation 1H
Sixty one-minute return observations. Sensitive enough to detect intraday regime shifts: when a coin tracking BTC starts to diverge, this reading drops first. The tradeoff is instability. A single anomalous minute can move a 60-point sample. Alone, this number produces noise. Against the 24H baseline, it becomes useful.
Values above 0.70 indicate short-term BTC alignment. Values below 0.40 indicate genuine short-term independence.
BTC Correlation 24H
1,440 one-minute return observations. This window is the baseline: resistant to short-term noise, reflecting the coin’s typical BTC relationship over a full trading day. A high 24H correlation means the asset normally follows Bitcoin. A low one means it trades on its own regardless.
That distinction makes the 1H reading interpretable. A coin dropping from 0.85 to 0.30 in one hour is a different situation from a coin dropping from 0.35 to 0.30. The 24H number tells you which one you are looking at.
You can compare both windows side by side in the live Binance BTC correlation table and switch between spot and perpetual venues without changing the metric definition.
The Divergence Signal: When 1H Drops Below 24H
Use these parameters as a pair. The signal is the gap between them.
| Condition | Reading | Interpretation |
|---|---|---|
| BTC Correlation 24H | 0.85 | Coin normally tracks BTC closely |
| BTC Correlation 1H | 0.30 | Coin has decoupled from BTC in the last 60 minutes |
| BTC price change (1H) | −0.2% | Bitcoin is flat |
| Coin price change (1H) | +3.1% | Coin is moving up |
Four things are true:
- The baseline is established. A 24H reading of 0.85 means this asset normally follows BTC. The divergence is meaningful because the baseline says so.
- The decoupling is recent. Whatever is driving this coin started in the last 60 minutes.
- The move is not BTC beta. Bitcoin is flat.
- Something coin-specific is active. A large buyer, news, a catalyst not yet visible on lower timeframes.
Without the 24H baseline, you have a coin that moved. With it, you have a deviation from an established pattern.
The Inverse: When 1H Strengthens Beyond 24H
A coin with a 24H BTC correlation of 0.30 whose 1H reading has jumped to 0.80 is getting dragged into a BTC-driven move it normally ignores. During sharp BTC drawdowns, forced liquidation drags previously independent assets along with the market. The correlation spike is the tell.
To screen for assets tightly coupled to BTC right now, set a high minimum on both parameters. To isolate the decoupling scenario, use a high 24H minimum with a low 1H maximum.
How to Configure This in the Scanner
Both parameters sit in the General filter category. They stack with the rest of the AnomIQ filter set using AND logic.
Filter Example 1: Decoupling with upward momentum
Coins that normally track BTC (24H ≥ 0.70) but have broken away in the last hour (1H ≤ 0.45), with elevated buy-side pressure:
BTC Correlation 24H >= 0.70
AND BTC Correlation 1H <= 0.45
AND Buy Volume Z-score (60m) >= 2.0
24H confirms the structural BTC relationship. 1H confirms the short-term break. Buy Volume Z-score confirms the direction.
Filter Example 2: Pure correlation window divergence
A broader sweep: coins where the short-term correlation has dropped from the 24H baseline, regardless of direction:
BTC Correlation 24H >= 0.75
AND BTC Correlation 1H <= 0.40
Combine with price change or Z-score filters to narrow to the directional cases that matter for your setup.
Filter Example 3: Macro-driven sweep detection
Coins where short-term correlation has spiked, meaning BTC-driven selling is pulling in otherwise independent assets:
BTC Correlation 24H <= 0.45
AND BTC Correlation 1H >= 0.75
AND Sell Volume Z-score (60m) >= 2.0
Useful during BTC drawdown sessions to identify which coins get dragged into the move despite no coin-specific reason.
Why Return-Based Correlation, Not Price-Based?
Over long periods, price-based correlation between crypto assets runs high. Most assets share the same general direction: up in bull markets, down in bear markets. Two assets can look tightly correlated because they both rose for six months, even if their daily moves were unrelated. Return-based correlation removes that. On each individual minute: did the coin move in the same direction and magnitude as BTC?
A high return correlation means the coin tracks BTC bar by bar. A low one means it moves on its own schedule, whatever BTC does.
Combining Correlation with Other Scanner Filters
A high buy/sell volume Z-score tells you volume is anomalous relative to this coin’s own history. It does not tell you whether that anomaly is coin-specific or BTC carrying the tape. Add a collapsed 1H correlation and you have the answer.
Pair Net Taker Imbalance with a collapsed 1H correlation: aggressive buying on a decoupled coin means someone is accumulating, not riding a broad market move. Correlation tells you whether the other signals are riding BTC or standing on their own.
That same relationship showed up in the larger 16,726-event study on what predicts big crypto moves: weaker BTC linkage helped separate larger idiosyncratic moves from quieter extreme-volume events.
Frequently Asked Questions
What is BTC correlation in crypto trading?
BTC correlation measures how closely an altcoin’s 1-minute returns track Bitcoin’s over a given window. The Pearson coefficient runs from −1 to +1. Near +1 means the coin moves in lockstep with BTC. Near 0 means it is moving on its own. Most liquid altcoins show BTC correlations above 0.70 on a 30-day basis, making Bitcoin the dominant driver of cross-asset behavior in crypto markets.
How do you detect when a crypto coin is decoupling from Bitcoin?
Compare the 1-hour and 24-hour BTC correlation readings. A coin with a 24H reading of 0.85 whose 1H reading drops to 0.30 while Bitcoin is flat and the coin is rising has decoupled. The 24H baseline confirms the coin normally tracks BTC, which makes the 1H collapse meaningful rather than typical independent behavior. That gap between the two windows is the signal.
What BTC correlation threshold should I use in a crypto scanner?
For divergence detection, pair BTC Correlation 24H ≥ 0.70 with BTC Correlation 1H ≤ 0.45. These are starting points. Lower the 1H maximum to tighten the filter or raise the 24H minimum to require a stronger baseline. Adding Buy Volume Z-score (60m) ≥ 2.0 as a third condition raises signal quality by confirming aggressive buying accompanies the decoupling.
Can BTC correlation be negative?
Yes. A Pearson coefficient below 0 means the coin’s 1-minute returns are moving inversely to BTC’s during the window. Sustained negative BTC correlation is rare for liquid altcoins. When it appears, it usually indicates an asset with structural inverse BTC exposure: a short perpetual, or a pair whose quote currency inverts the direction. Values near zero indicate independence, not inversion.
Does a high 24-hour BTC correlation make the divergence signal more reliable?
It raises the probability. A coin that normally runs at 0.85 dropping to 0.25 carries more signal than a coin that normally runs at 0.40 dropping to 0.25. The higher the baseline, the more informative the deviation. Same logic as Z-score normalization: you are measuring deviation from a known structural behavior, not an absolute number.
Does BTC correlation work the same across all cryptocurrencies?
The BTC reference series is the same for all instruments: the consolidated BTC return series at 1-minute cadence. A reading of 0.80 means the same thing for ETHUSDT and a small-cap altcoin. The correlation always measures against BTC, not against the coin’s own history. This makes thresholds portable across the full symbol universe without per-coin calibration.
Check the live Binance perpetuals BTC correlation table for current readings. When you want the relationship monitored continuously across every active pair, set the thresholds once in AnomIQ and the scanner flags decoupling events as they develop in the 1-hour window.